Hey there, digital explorer! 🌐
Ever wondered just how many people are double-tapping that Instagram post you published right now?
Or how many tweets are flying across the Twitterverse this very second? Or how many snaps are lighting up screens on Snapchat?
Or perhaps you’re wondering which platform has the highest brand engagement rate?
If your curiosity is tingling, you’re in the right place.
Welcome to the ultimate list of 200+ social media statistics that’ll make your jaw drop. And yes, these are fresh out of the oven for 2024.
Here’s a teaser: As of October 2023, there are an estimated active 4.95 billion global social media users, that’s 60.6% of the world population.
And if that doesn’t make your eyebrows shoot up, consider this: every single minute, YouTube gets flooded with 500 hours of fresh video content.
Crazy, isn’t it? 🤯
But wait, there’s more. 🚀
Whether you’re Team Facebook, an Instagram aficionado, a TikTok trendsetter, a Twitter trailblazer, a YouTube junkie, a LinkedIn leader, a Snapchat superstar, or a Pinterest pro – we’ve got something for everyone.
We’ve got the social media demographics and engagement stats you are looking for.
Buckle up, because we’re about to take you on a whirlwind tour of the social media facts.
Let’s dive in!
General Social Media Facts
In today’s digital landscape, social media facts shed light on evolving user behaviors and emerging social media marketing trends. Platforms like Snapchat and TikTok dominate the Gen Z space, while B2B social media trends influence business decisions.
With shifts towards short-form content and immersive shopping, keeping abreast of current trends is crucial for any successful marketing strategy.
Here is a blend of general social media facts that will give you a common perspective of the social space and the audience:
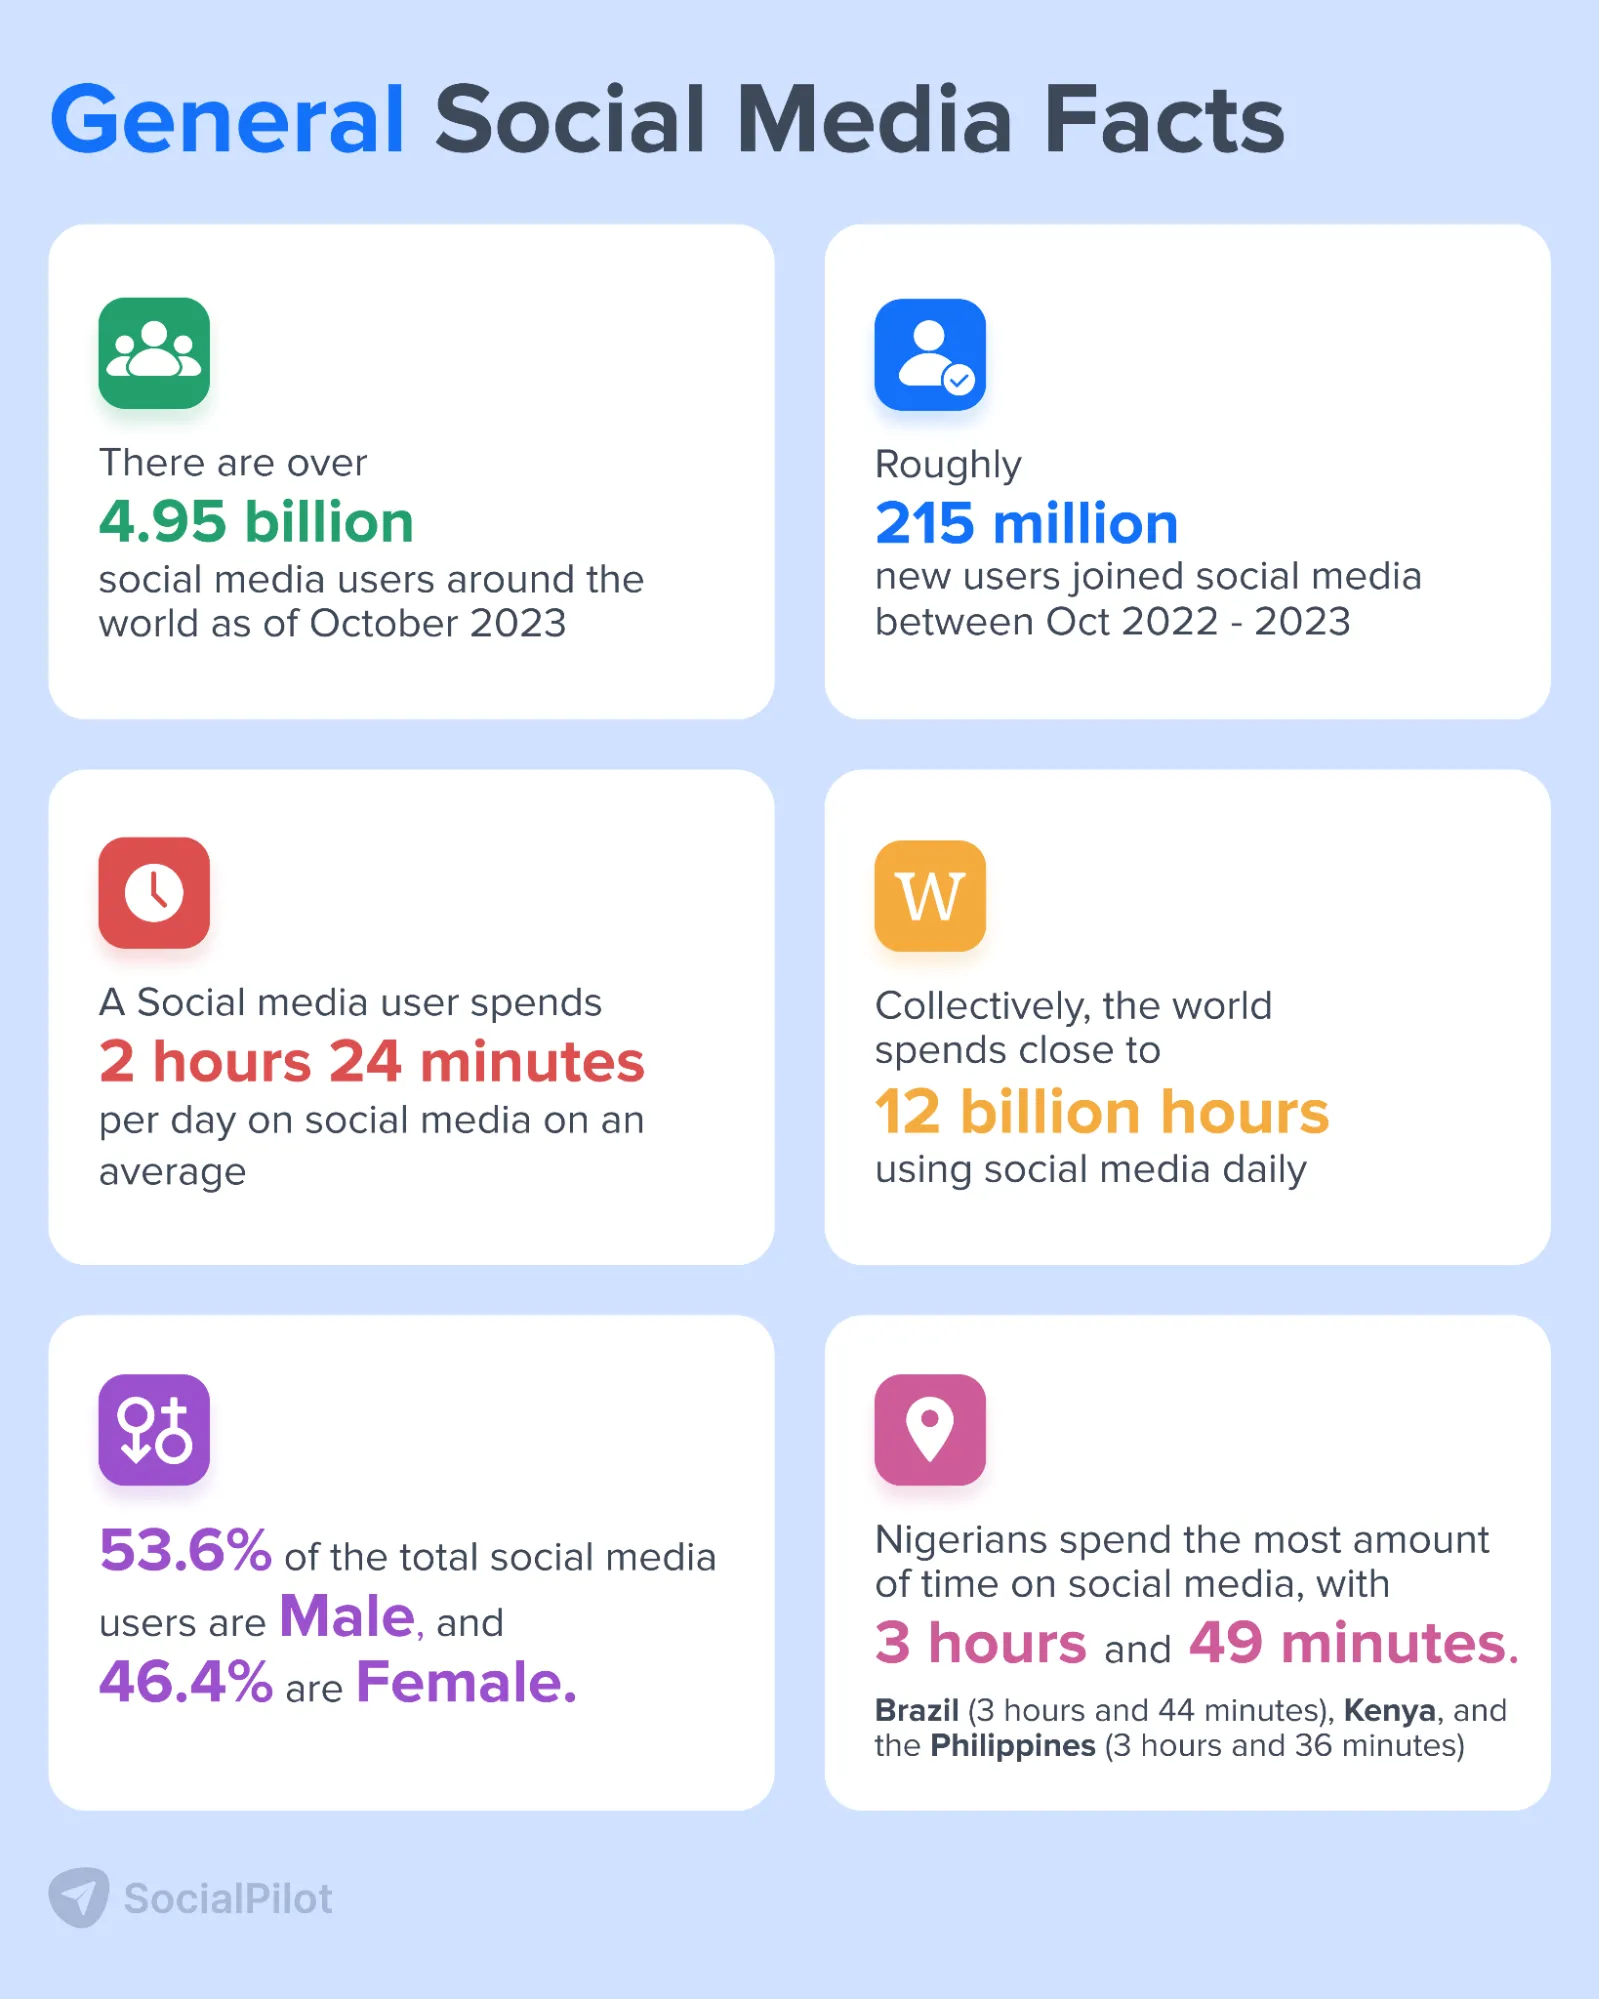
- There are over 4.95 billion social media users around the world as of October 2023, equating to 61.4 percent of the total global population.
- Roughly 215 million new users have joined social media over the past 12 months (since October 2022). This equates to annualized growth of 4.5 percent, at an average rate of 6.8 new users every single second.
- A social media user actively uses or visits an average of 6.7 different social media platforms each month.
- An average social media user spends 2 hours 24 minutes per day on social media.
- Collectively, the world spends close to 12 billion hours using social media daily, which equates to 1.35 million years of human existence.
- 53.6% of the total social media users are Male, and 46.4% of the social media users are Females.
- 48.7% of social media users from the age group of 16-64 years use social media to keep in touch with friends and family.
- Nigerians spend the most amount of time on social media with 3 hours and 49 minutes. At 3 hours and 44 minutes, Brazil comes to the second spot, followed by Kenya and the Philippines at 3 hours and 36 minutes.
Social Media Advertising Statistics
Leveraging social media advertising statistics is crucial for optimizing campaigns and maximizing reach across various platforms. Stay abreast of the latest trends to craft compelling ads that resonate with your target audience and drive conversions.
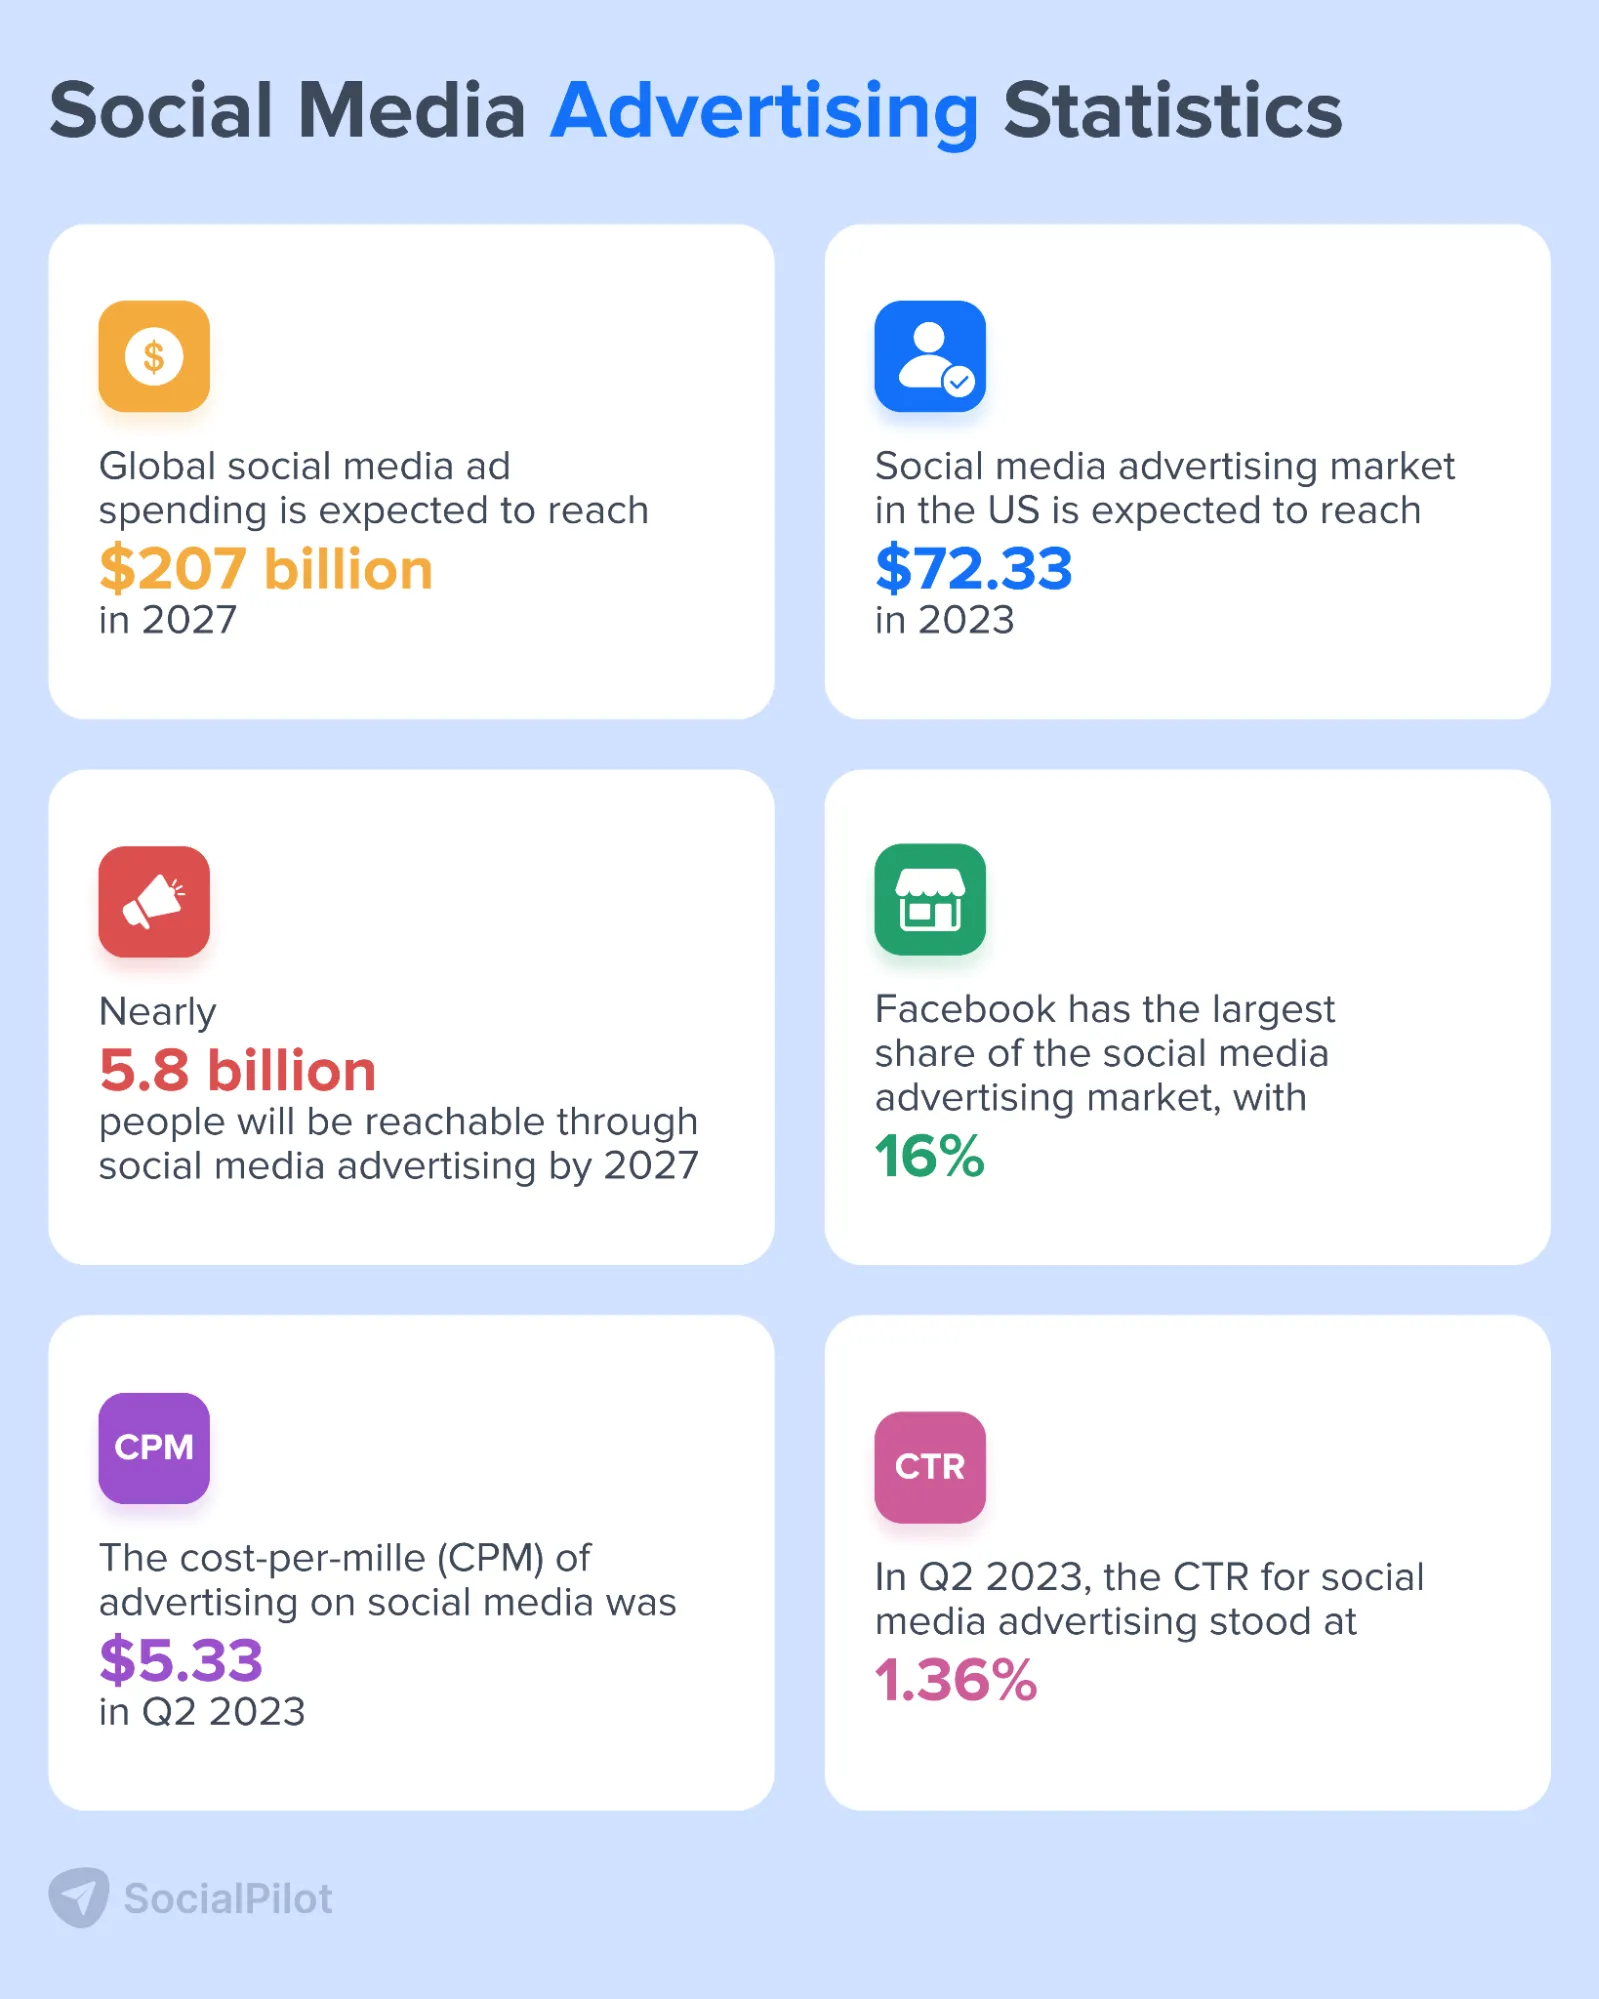
- Global ad spending in the social media advertising market is expected to reach $219.8 billion in 2024.
- Ad spending in the social media advertising market in the US is expected to reach $76.40 billion in 2024, making it the largest in expenditure. China and the UK come in second and third rank with $71.38 billion and $9.7 billion, respectively.
- Nearly 5.8 billion people will be reachable through social media advertising by 2027.
- By 2027, it is estimated that $247.30 billion will be spent on mobile-specific ads on social media platforms.
- Facebook has the largest share in the social media advertising market with 16%.
- The cost-per-mille (CPM) of advertising on social media was $5.33 in Q2 2023.
- In Q2 2023, the CTR for social media advertising stood at 1.36%, a jump from 1.2% in Q2 2023.
Facebook Statistics
Facebook struggled to maintain its “most popular platform” status last year. Meta stocks also tanked, losing about two-thirds of their value since peaking in September 2021.
Seeing the next generation of users flocking to other platforms, Facebook piggybacked on Instagram’s excellent features and made rigorous changes in its algorithm. Such efforts made audiences seek Facebook feeds more than TikTok to watch short-form videos.
Even with setbacks, Facebook rules the social commerce domain and gives retailers access to its massive audience base.
Facebook has also introduced a new set of group features, such as Reels for Groups and enhanced group admin features to help marketers elevate the community experience.
While you work on your campaigns for 2024, let these insightful Facebook statistics power your Facebook marketing strategy. It is time to create dynamic, high-converting content and stay consistent with your posting using Facebook publishing tools.
Facebook Usage Stats
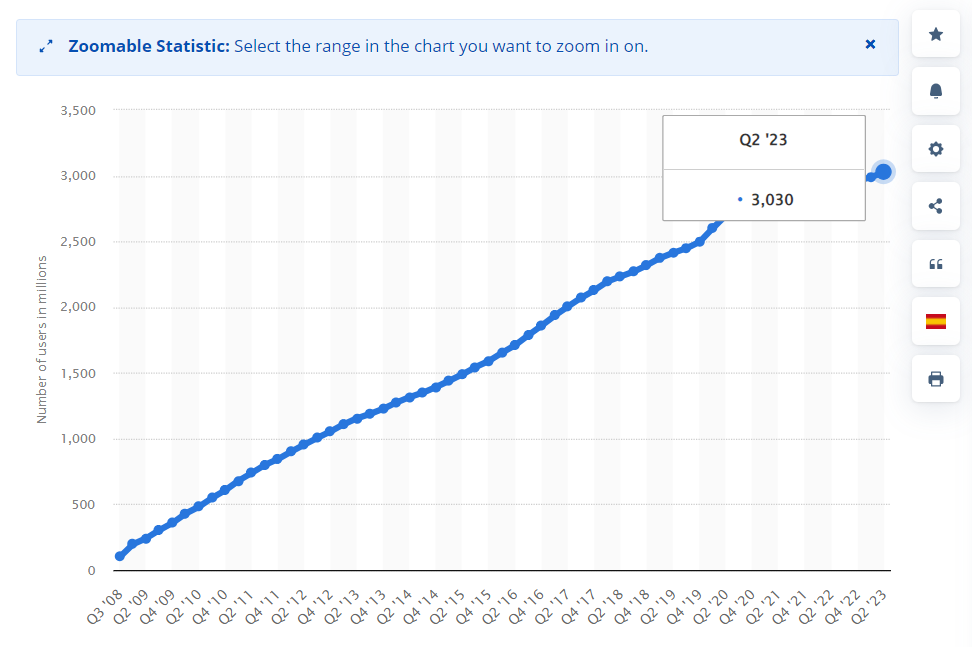
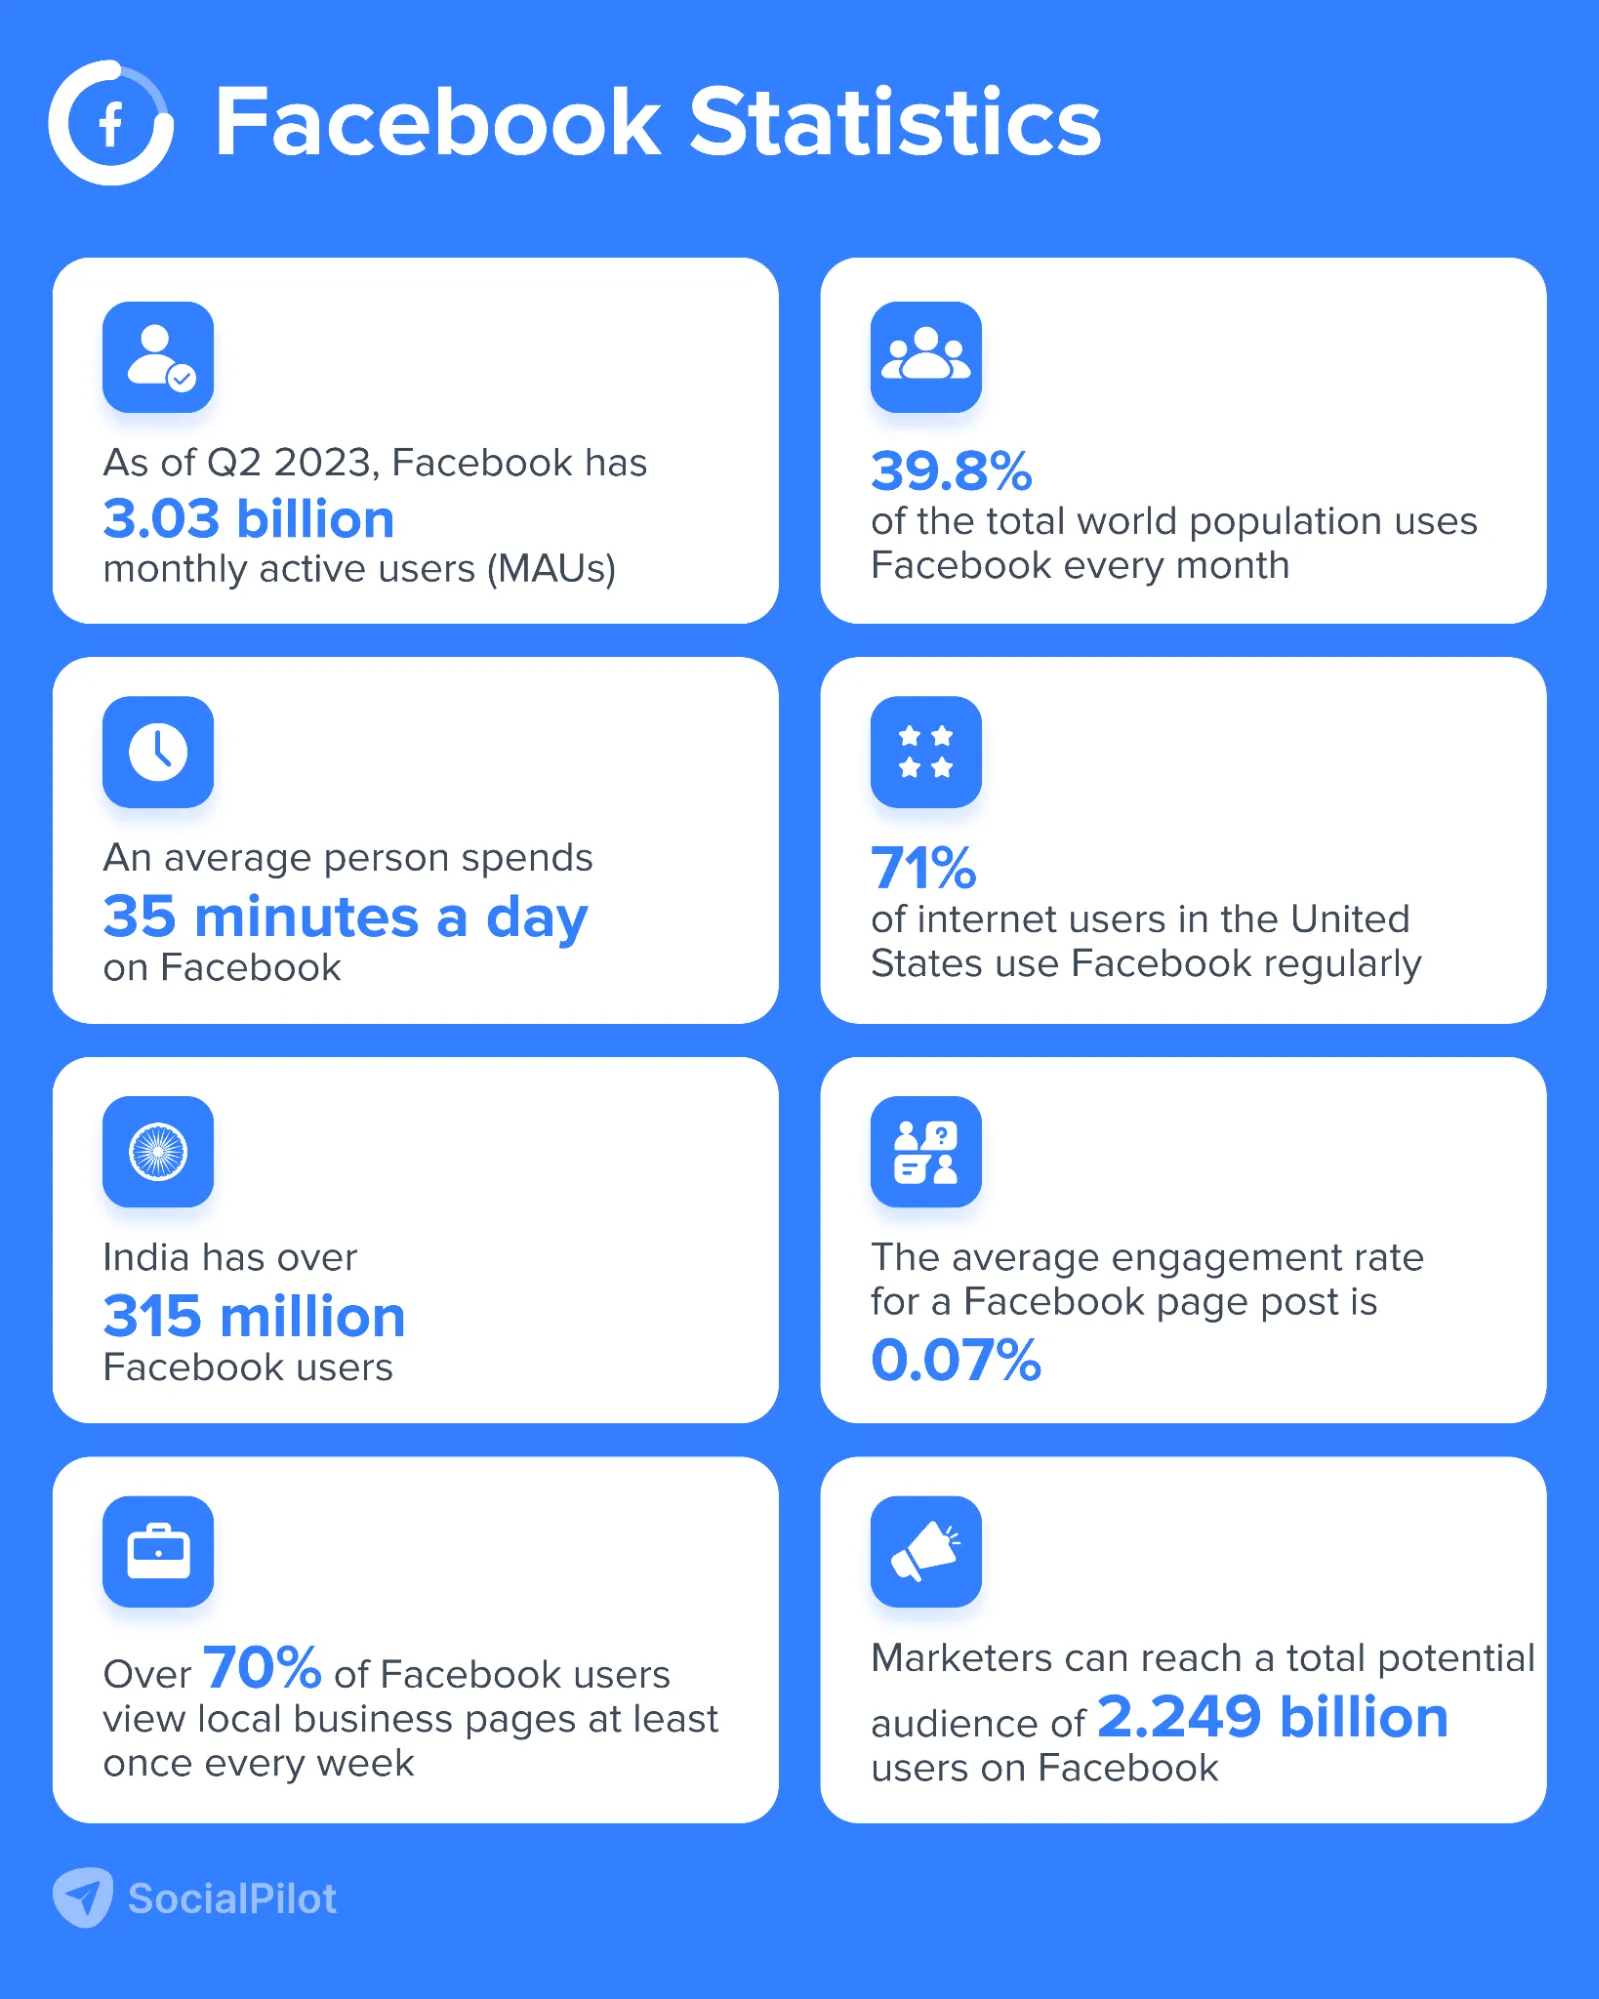
- Facebook has 3.03 billion monthly active users as of Q2 of 2023, making it the most used social media platform with a growth of 2% YOY.
- As of Q2 2023, the daily active user number on Facebook reached 2.06 billion, an increase of 3% year-over-year.
- Facebook is the world’s third-most downloaded app.
- The average US adult spends 33 minutes a day on Facebook.
- Users spend an average of 19.7 hours a month on Facebook.
- An average person spends 35 minutes a day on Facebook.
- 39.8% of the total world population uses Facebook every month.
Facebook Demographics Stats
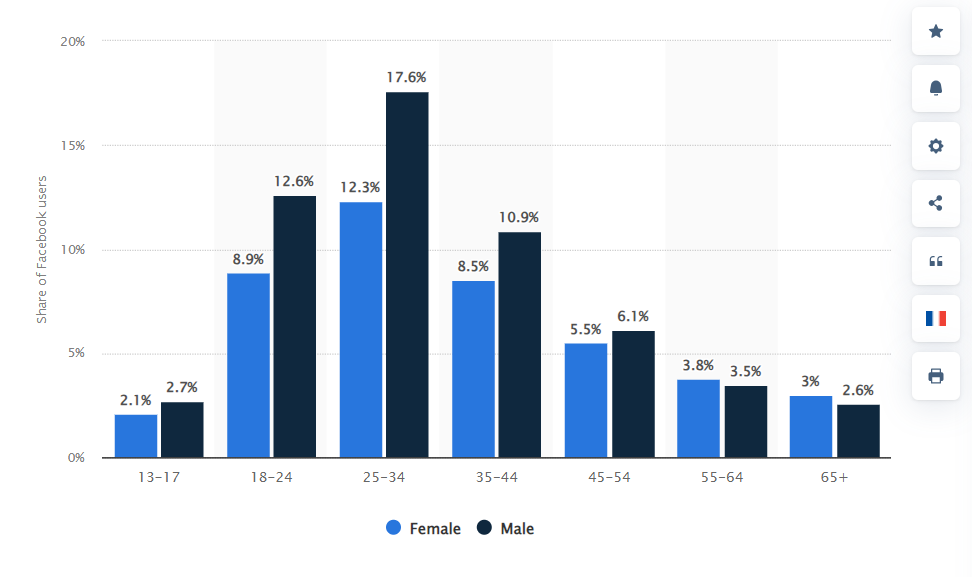
- Facebook is the favorite platform for the 25-34 age group, accounting for 17.6% of global users.
- An estimated 71% of internet users in the United States use Facebook regularly.
- Only 18% of American users think the platform protects their data and privacy.
- India has the largest Facebook audience base, with almost 315 million users, followed by the US, Indonesia, and Brazil, with 175 million, 119.9 million, and 109.05 million users, respectively.
- 7% of Gen Z users (18-25) plan to quit Facebook in 2023.
Facebook Engagement Stats
- The average engagement rate for a Facebook page post is 0.07%.
- Each month, the typical user averages 12 likes, 5 comments, and 1 share.
- Facebook videos get more than 4 billion video views every day.
- Facebook generates 4 million likes every minute.
- Over 1 billion Stories get posted every day across Facebook apps.
- 1.8 billion people interact on Facebook groups every month.
- 90% of Facebook users post native videos, and a video post increases interaction by 600% on Facebook.
- Live video engagement is 26% on Facebook, higher than any other social media platform.
Facebook Business Stats
- Over 70% of Facebook users view local business pages at least once every week.
- 81% of businesses share videos on Facebook.
- There are 250 million Facebook Shops worldwide.
- Facebook Shops have more than 1 billion monthly active users.
- Customers who engage in Facebook live chat are 53% more likely to make a purchase from a business.
- 96% of B2C marketers and 91% of B2B marketers use Facebook.
Facebook Ads Insights
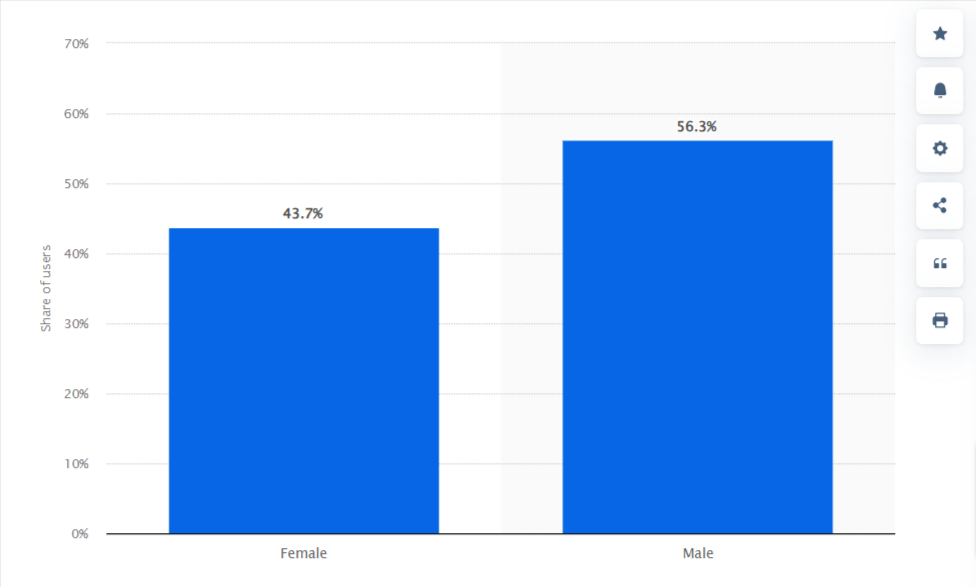
- 43.5% of the Facebook ad audience is female, while 56.5% is male.
- Marketers can reach a total potential audience of 2.249 billion users through Facebook.
- Facebook has over 10 million active advertisers as of 2023.
- 34.1% of adults worldwide over the age of 13 see Facebook advertisements.
- As of January 2024, Facebook’s CPC was $0.544.
- In 2022, Facebook generated nearly $114 billion dollars in advertising revenue and is expected to grow to $127 billion by 2027.
- During June 2021, a typical female Facebook user clicked on 14 ads, while men only clicked on 10 ads.
- Audiences aged 18-24 spend 75% of their time on Facebook watching video ads.
- 71% of shoppers feel they see relevant video ads on Facebook.
Instagram Statistics
Instagram stayed on course to become the flagbearer of the creators’ economy in 2022. An exciting and practical move, considering that a significant portion of Gen Z hopes to monetize their interests on Instagram.
The platform continued releasing and enhancing several features at breakneck speed to help creators thrive. These new features align with Meta’s vision of bringing together an array of features that help brands and businesses collaborate with creators better.
It’s time to understand Instagram statistics and improve your Instagram marketing strategies, create engaging posts, and streamline your scheduling using Instagram marketing tools.
Instagram Usage Stats
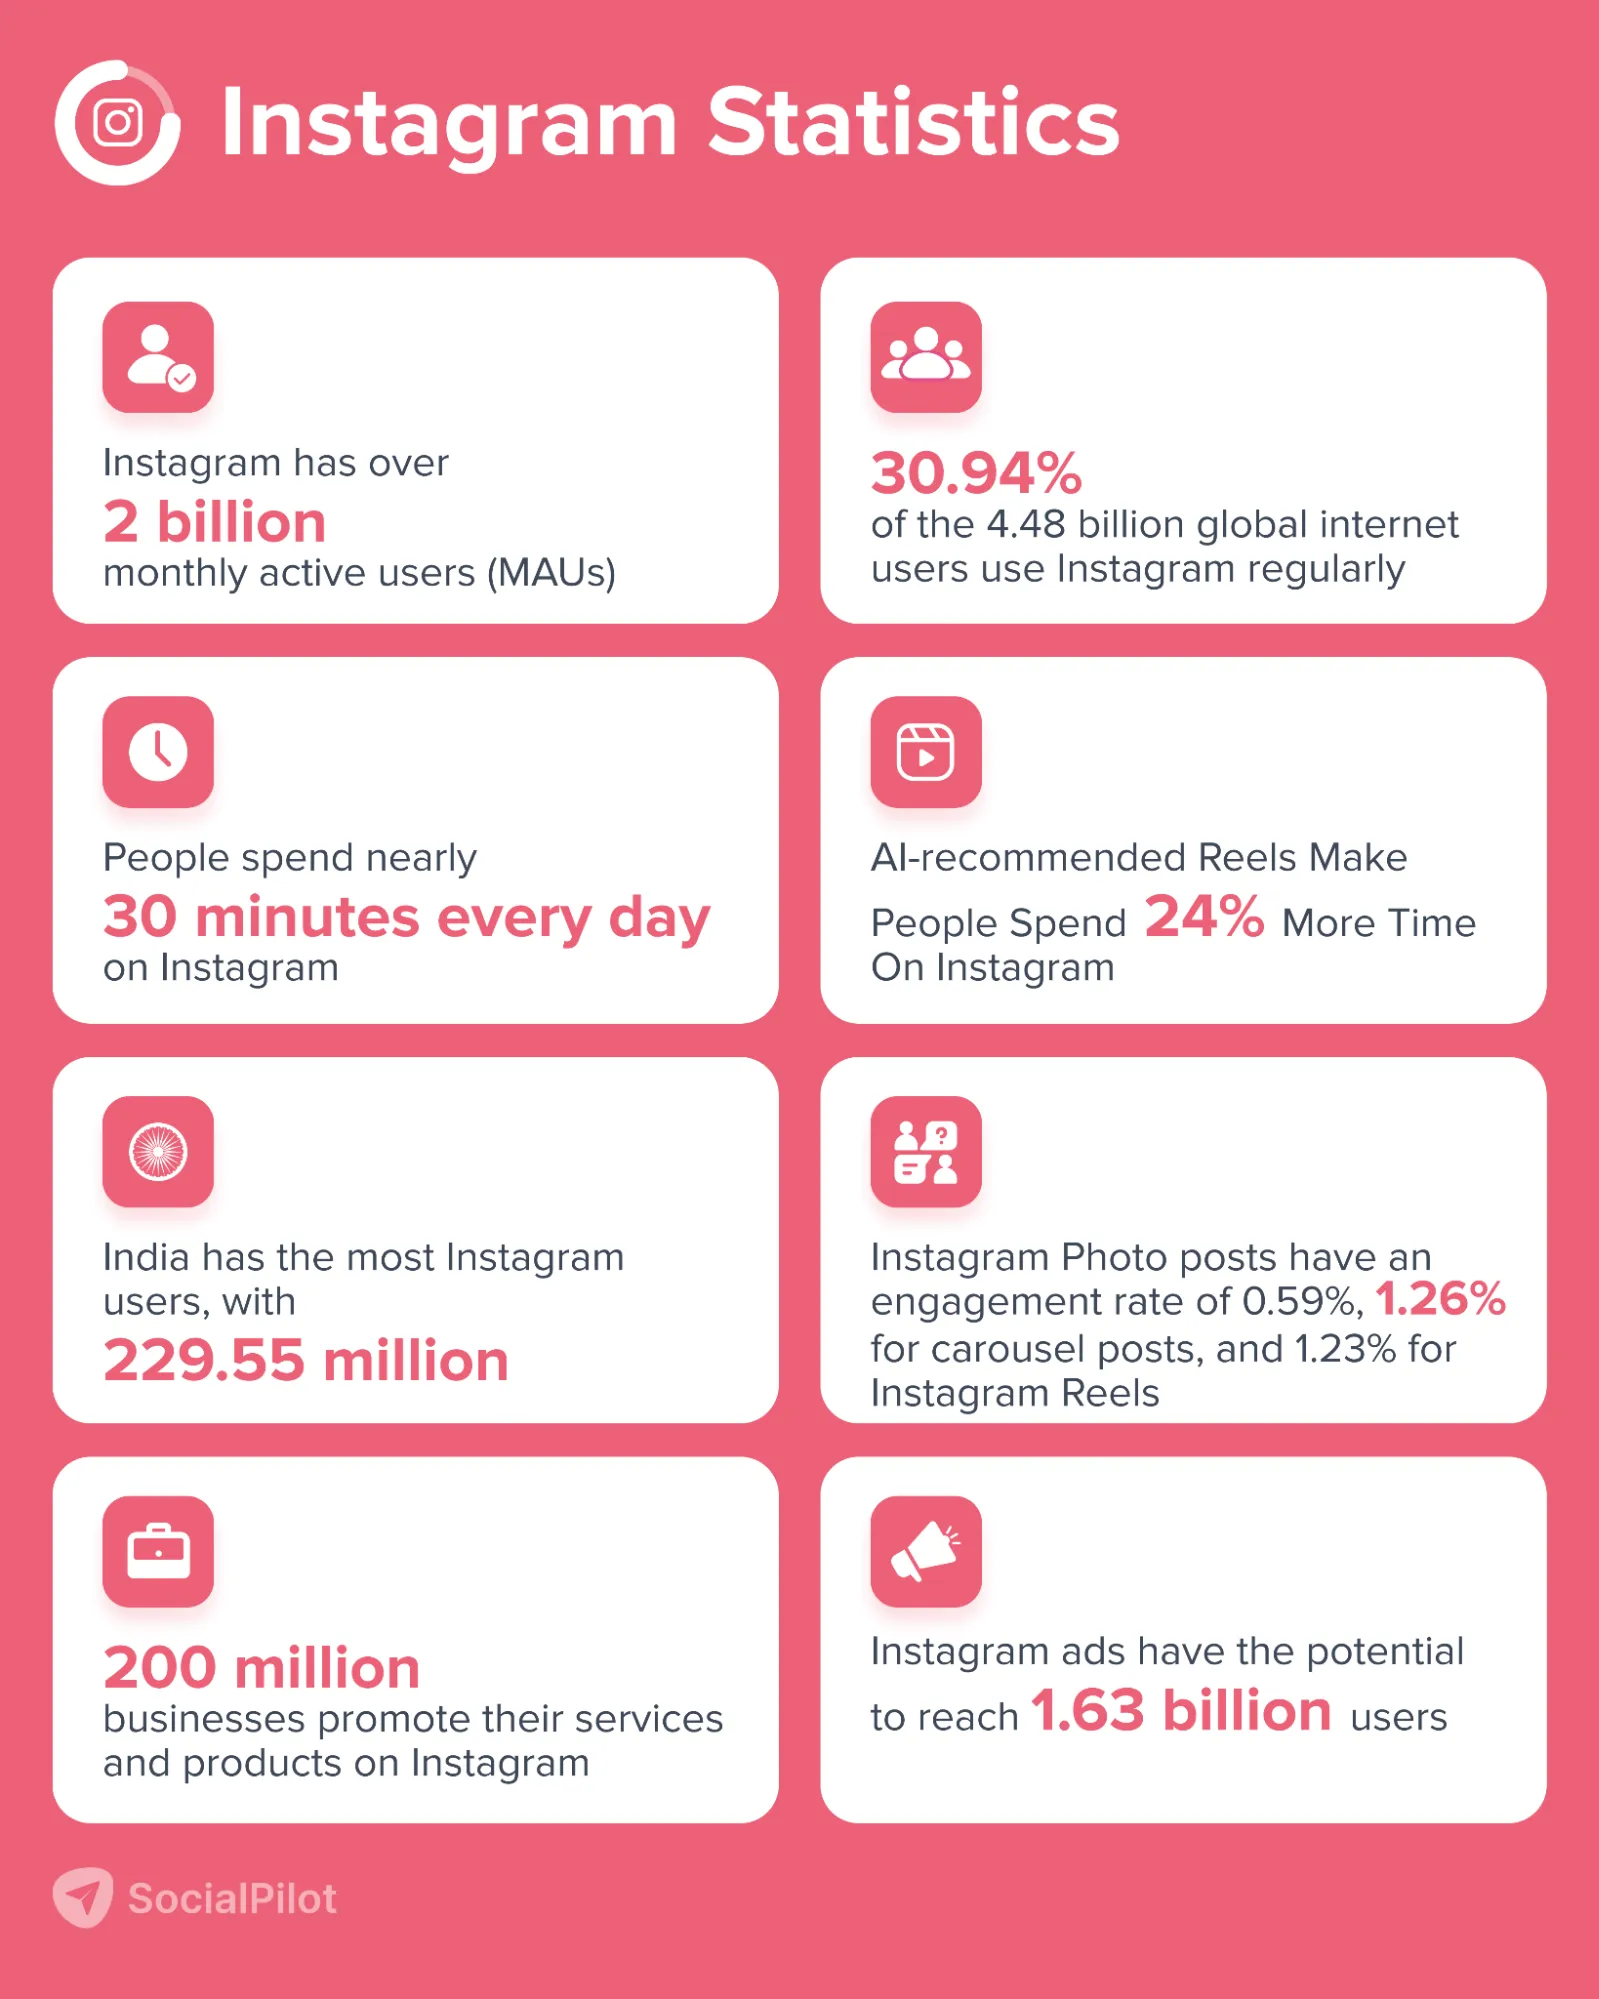
- Instagram has over 2 billion monthly active users.
- Instagram has 500 million+ daily active users.
- Instagram is the 4th most popular social media in the world in terms of MAUs.
- Approximately 30.94% of the 4.48 billion global internet users use Instagram regularly.
- Instagram users spend an average of 12 hours per month.
- People spend nearly 30 minutes every day on Instagram.
- US adults spend 33.1 minutes daily on Instagram.
- AI-recommended Reels Make People Spend 24% More Time On Instagram.
Instagram Demographics Stats
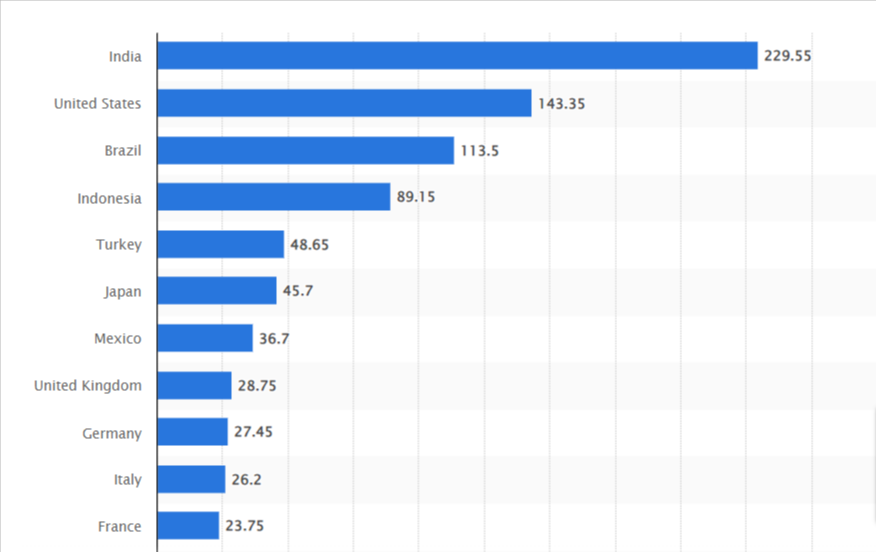
- India has the most Instagram users with 229.55 million, followed by the US (143.55 million), and Brazil (113.5 million) – as of January 2023.
- Instagram is used by 25.31 % of the world’s population.
- The 18-34 age group is the largest of the demographics, contributing to 60% of total Instagram users.
- As of 2021, Gen Z users in the US spend almost 5 hours per week on Instagram.
- 51.8% of the total Instagram users are males and 48.2% are females.
Instagram Engagement Stats
- The average engagement rate for all post types is 0.71%, 0.59% for photo posts, 1.26% for carousel posts, and 1.23% for Instagram Reels.
- The average Instagram engagement rate for business accounts with less than 10,000 followers is 0.98%.
- The highest Instagram Reels engagement rates are recorded by Instagram accounts with fewer than 5,000 followers, up to 3.79% on average.
- A total of 4.2 billion likes are registered on Instagram each day.
- On average, 10.7 hashtags are used in Instagram posts.
Instagram Business Stats
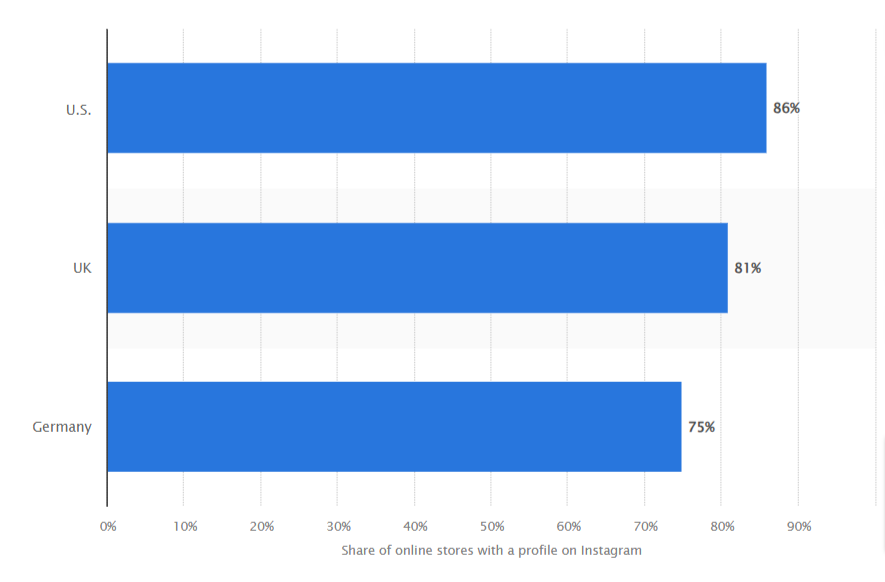
- There are over 200 million businesses on Instagram promoting their services and products.
- US-based online stores lead with 86% Instagram accounts, followed by 81% accounts from the UK and 75% from Germany-based online stores.
- 90% of Instagram users follow at least one business account.
- The average Instagram business account achieves 0.79% in follower growth monthly.
- On average, major brands post on Instagram 1.56 times every day.
- 62% of users say they are more interested in a brand after seeing it in an Instagram Story.
- 54% of all influencers on Instagram are nano-influencers, while 33% are micro-influencers.
Instagram Ads Insights
- Instagram ads have the potential to reach 1.63 billion users
- Instagram marketers spend 69% of their budget on influencer marketing on Instagram.
- Micro-influencers, who generally have 50,000-100,000 fans, are used by businesses to advertise their products.
- Instagram Stories ad revenue is expected to increase to $20.03 billion in 2023.
- The 18-24 age group accounts for the largest section of Instagram’s advertisement audience.
Twitter Statistics (Now ‘X’)
The rebranding of Twitter to “X” is one of the most talked-about events in the social media landscape in 2024. Such a significant change to a platform that has been a staple in our digital lives for over a decade was bound to create waves.
What’s fascinating is the unexpected boon that came with the renaming. This decade-old platform’s rebranding led to a surge in daily users, driven by curiosity and a media spotlight. Businesses, especially advertisers, took note, resulting in increased ad spending on Twitter.
Despite the name change, the platform’s original essence remains. X is unparalleled in spreading news and spotting trends, making it a prime business tool. It’s a one-stop shop for finding out what’s happening in the world.
And let’s not forget that this platform is still a sensational way to reach your target audience.
So, while you plan to include these new features in your 2024 marketing plan, keep in mind these Twitter statistics and use Twitter tools to magnify your reach.
Twitter Usage Stats
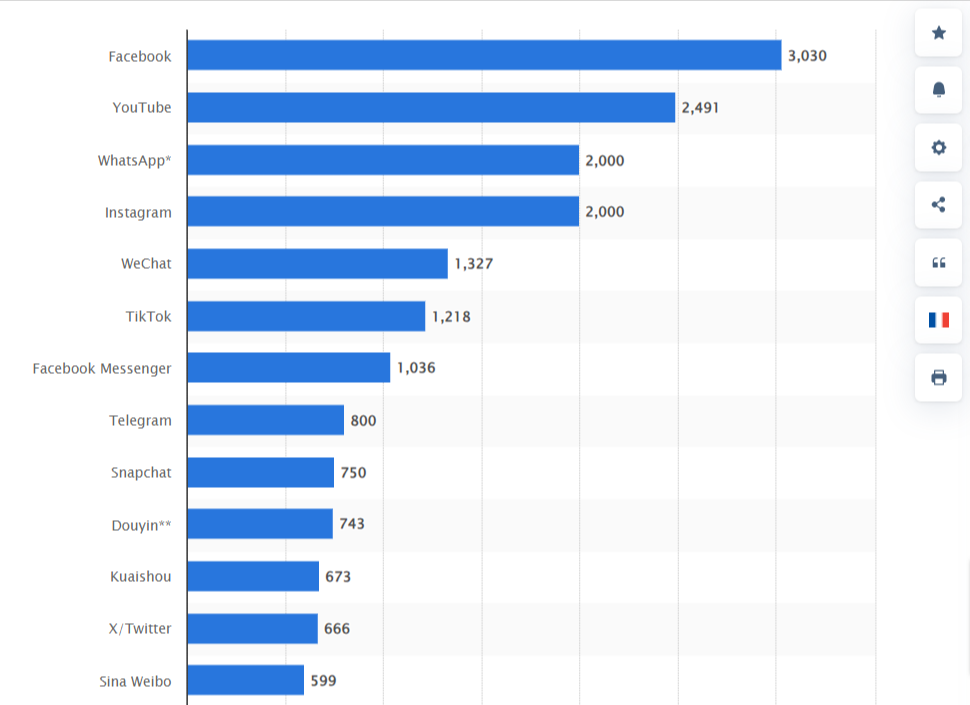
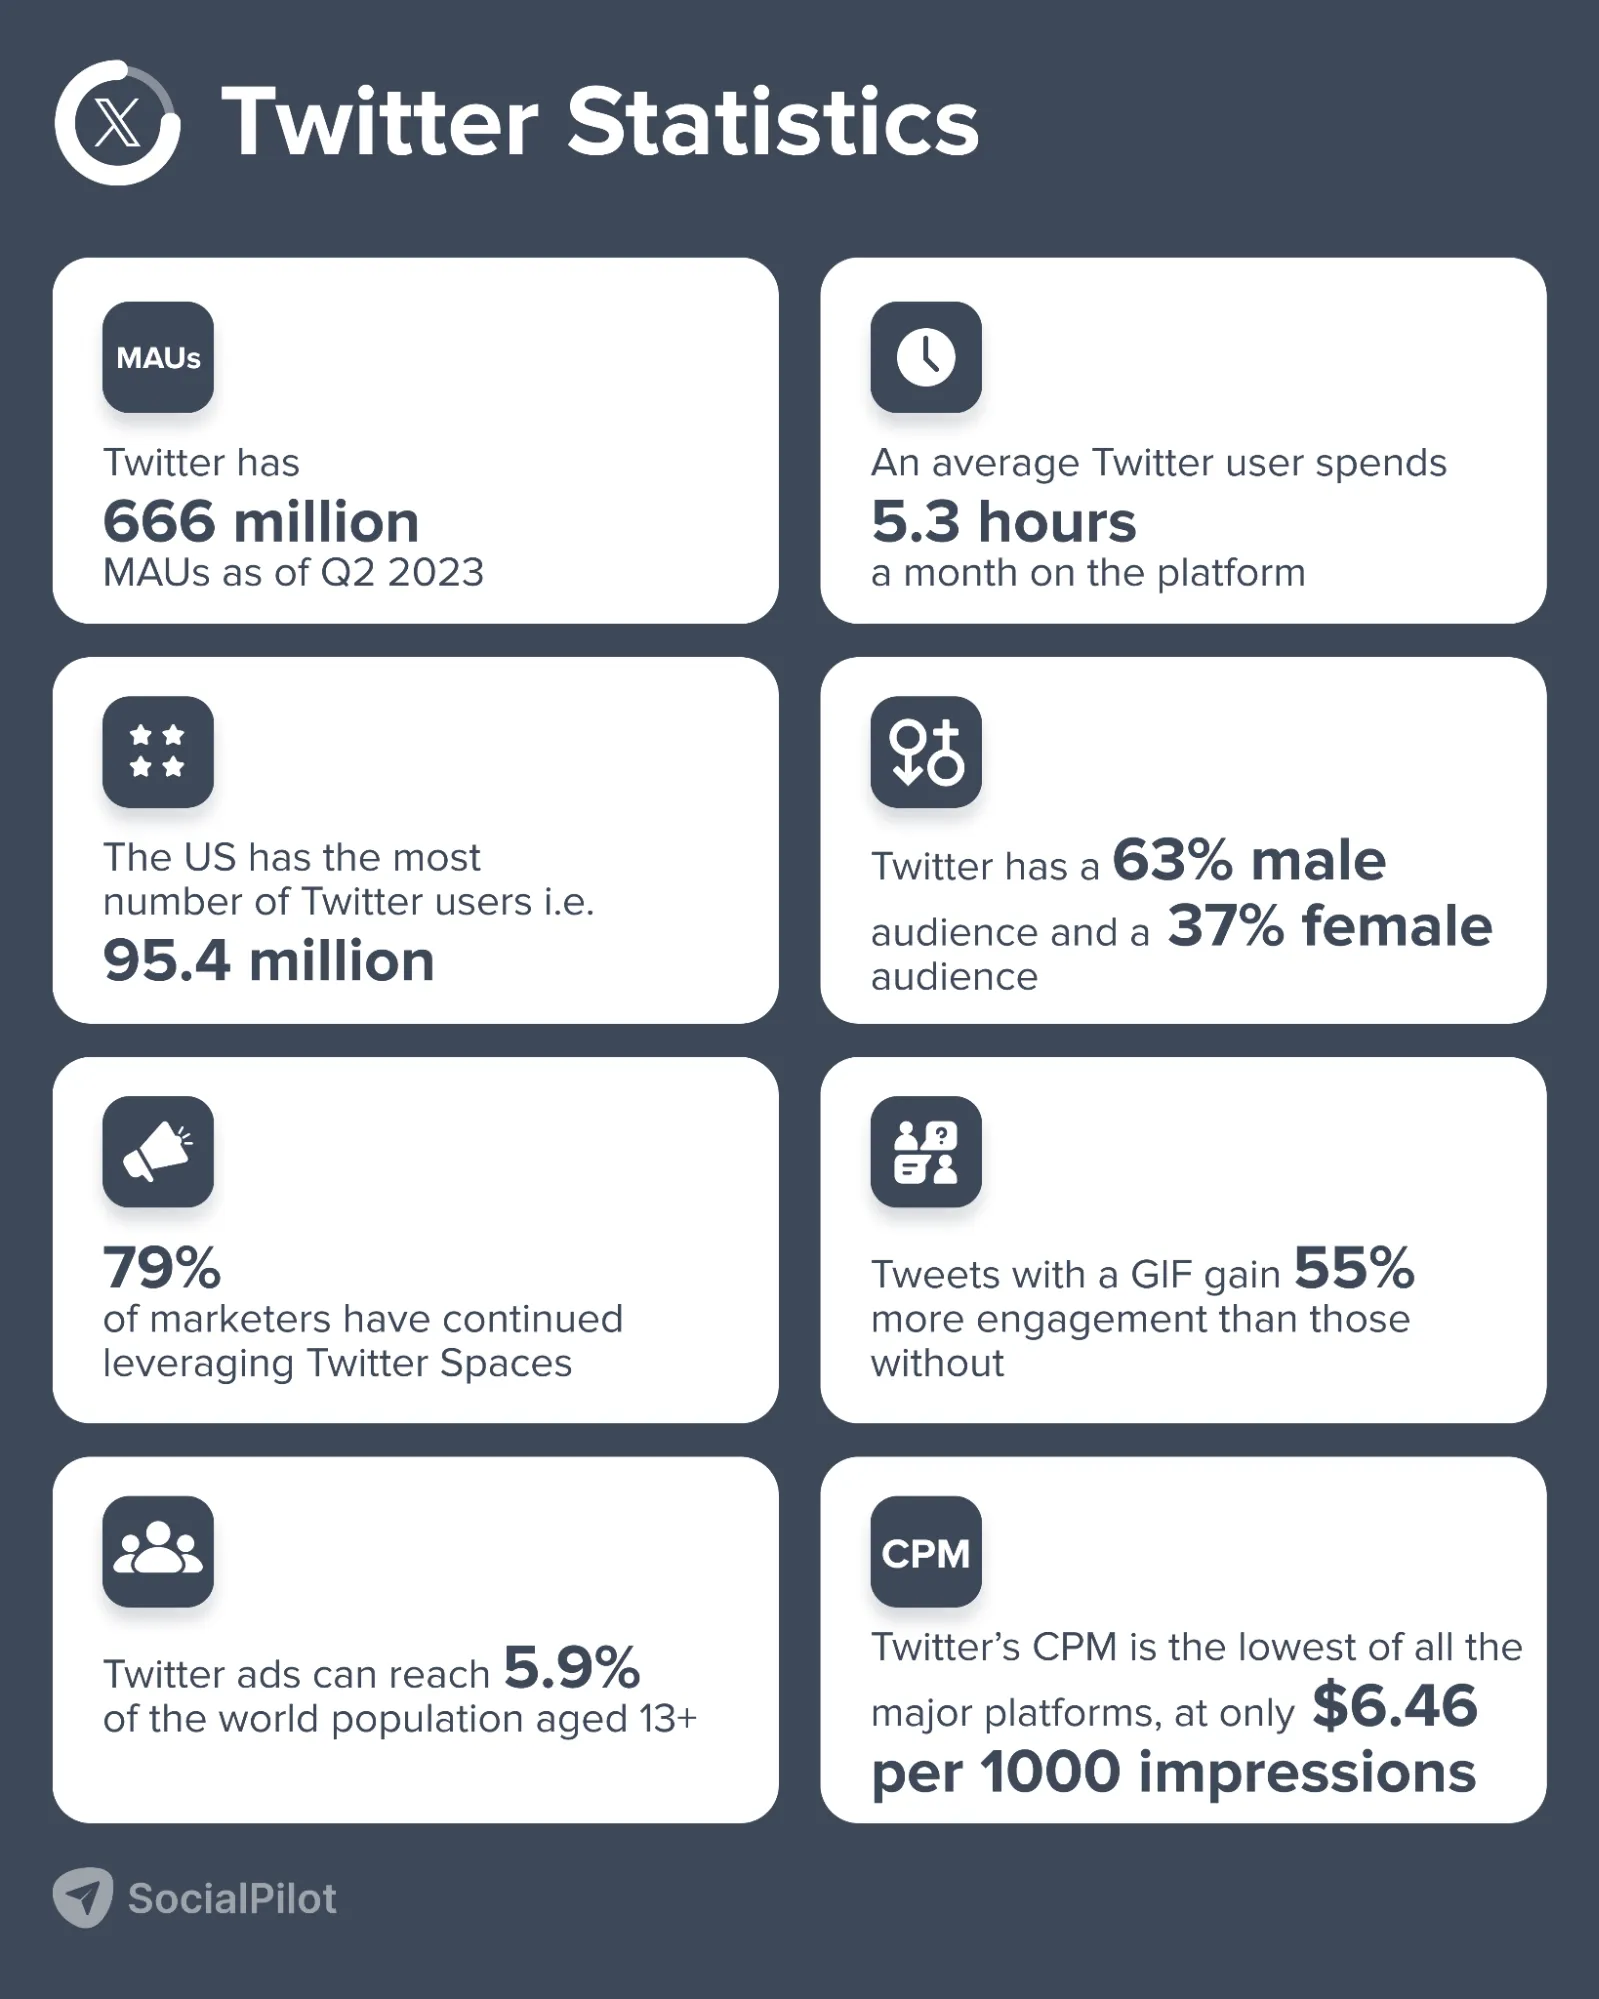
- Twitter has 666 million monthly active users as of October 2023.
- An average Twitter user spends 5.3 hours a month on the platform.
- Twitter users in the US, on average, spend 34.1 minutes on the platform daily.
- On average, 6000 tweets are sent every second, that is 500 million a day and 200 billion tweets are sent out annually.
- One-fifth of Twitter users below the age of 30 visit the platform frequently to update themselves on their favorite topics.
Twitter Demographics Stats
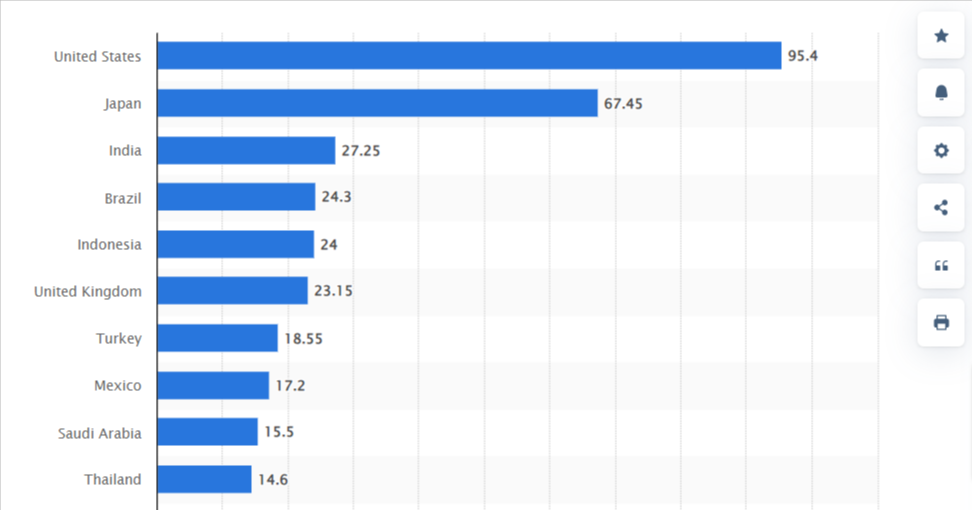
- The US has the most Twitter users (95.4 million), followed by Japan and India with 67.45 and 27.25 million users, respectively.
- X, formerly known as Twitter, has a 63% male audience and a 37% female audience – as of January 2023.
- Most of Twitter’s audience (38.5%) is in the 25-34 age group. People aged between 13 and 17 years make up just 6.6% of the user base.
- Twitter is the 12th most popular social media platform in the world in terms of users.
Twitter Engagement Stats
- 79% of marketers have continued leveraging Twitter Spaces.
- The average number of hashtags used daily on Twitter is 125 million.
- Football conversation on Twitter is up 27% since January 2019.
- Tweets with a GIF gain 55% more engagement than those without.
- There are over 2 billion video views on Twitter each day, which is 67% YoY growth.
- The top 10% of tweeters contribute 92% of tweets in the US.
- Twitter’s timeline generates +31% higher emotional connection and +28% higher levels of memorability versus the social media average.
Twitter Business Stats
- 16% of internet users aged 16-64 use Twitter for brand research.
- 77% of Twitter users feel more positive about brands that are community and society-focused.
- Twitter has 41.5 million monetizable daily active users in the United States.
- As of Q2 2022, Twitter has 237.8 million daily active monetizable users across the world.
- Twitter has a market cap of $41.09 billion as of September 2023.
Twitter Ads Insights
- Twitter generated $4.37 billion in ad revenue in 2022.
- Twitter’s cost per mile (CPM) is the lowest of all the major platforms, at only $6.46 per 1000 impressions.
- Twitter ads have the potential to reach 372.9 million people.
- Twitter ads can reach 5.9% of the world population aged 13+.
- The average Twitter ad’s ROI is 40% higher than other channels.
- 29.6% of Twitter ad audiences are female, and 70.4% are male.
Twitter provides immense possibilities for brands and individuals to communicate with their audience quickly.
You need to schedule engaging tweets at the right time, monitor brand mentions, respond quickly, reach out to influencers, and collaborate with other brands for cross-promotion, analysis, and much more.
LinkedIn Statistics
Are you ready to jump on the LinkedIn bandwagon and up your marketing game?
LinkedIn has come a long way from just being a job-seeking platform. It has introduced new features like Creator Mode, Post Templates, Link Stickers, and Pinned Comments to empower thought leaders and help businesses engage with their community.
Craft your marketing strategies by taking insights from the below LinkedIn statistics and leverage LinkedIn tools to leave an impact.
LinkedIn Usage Stats
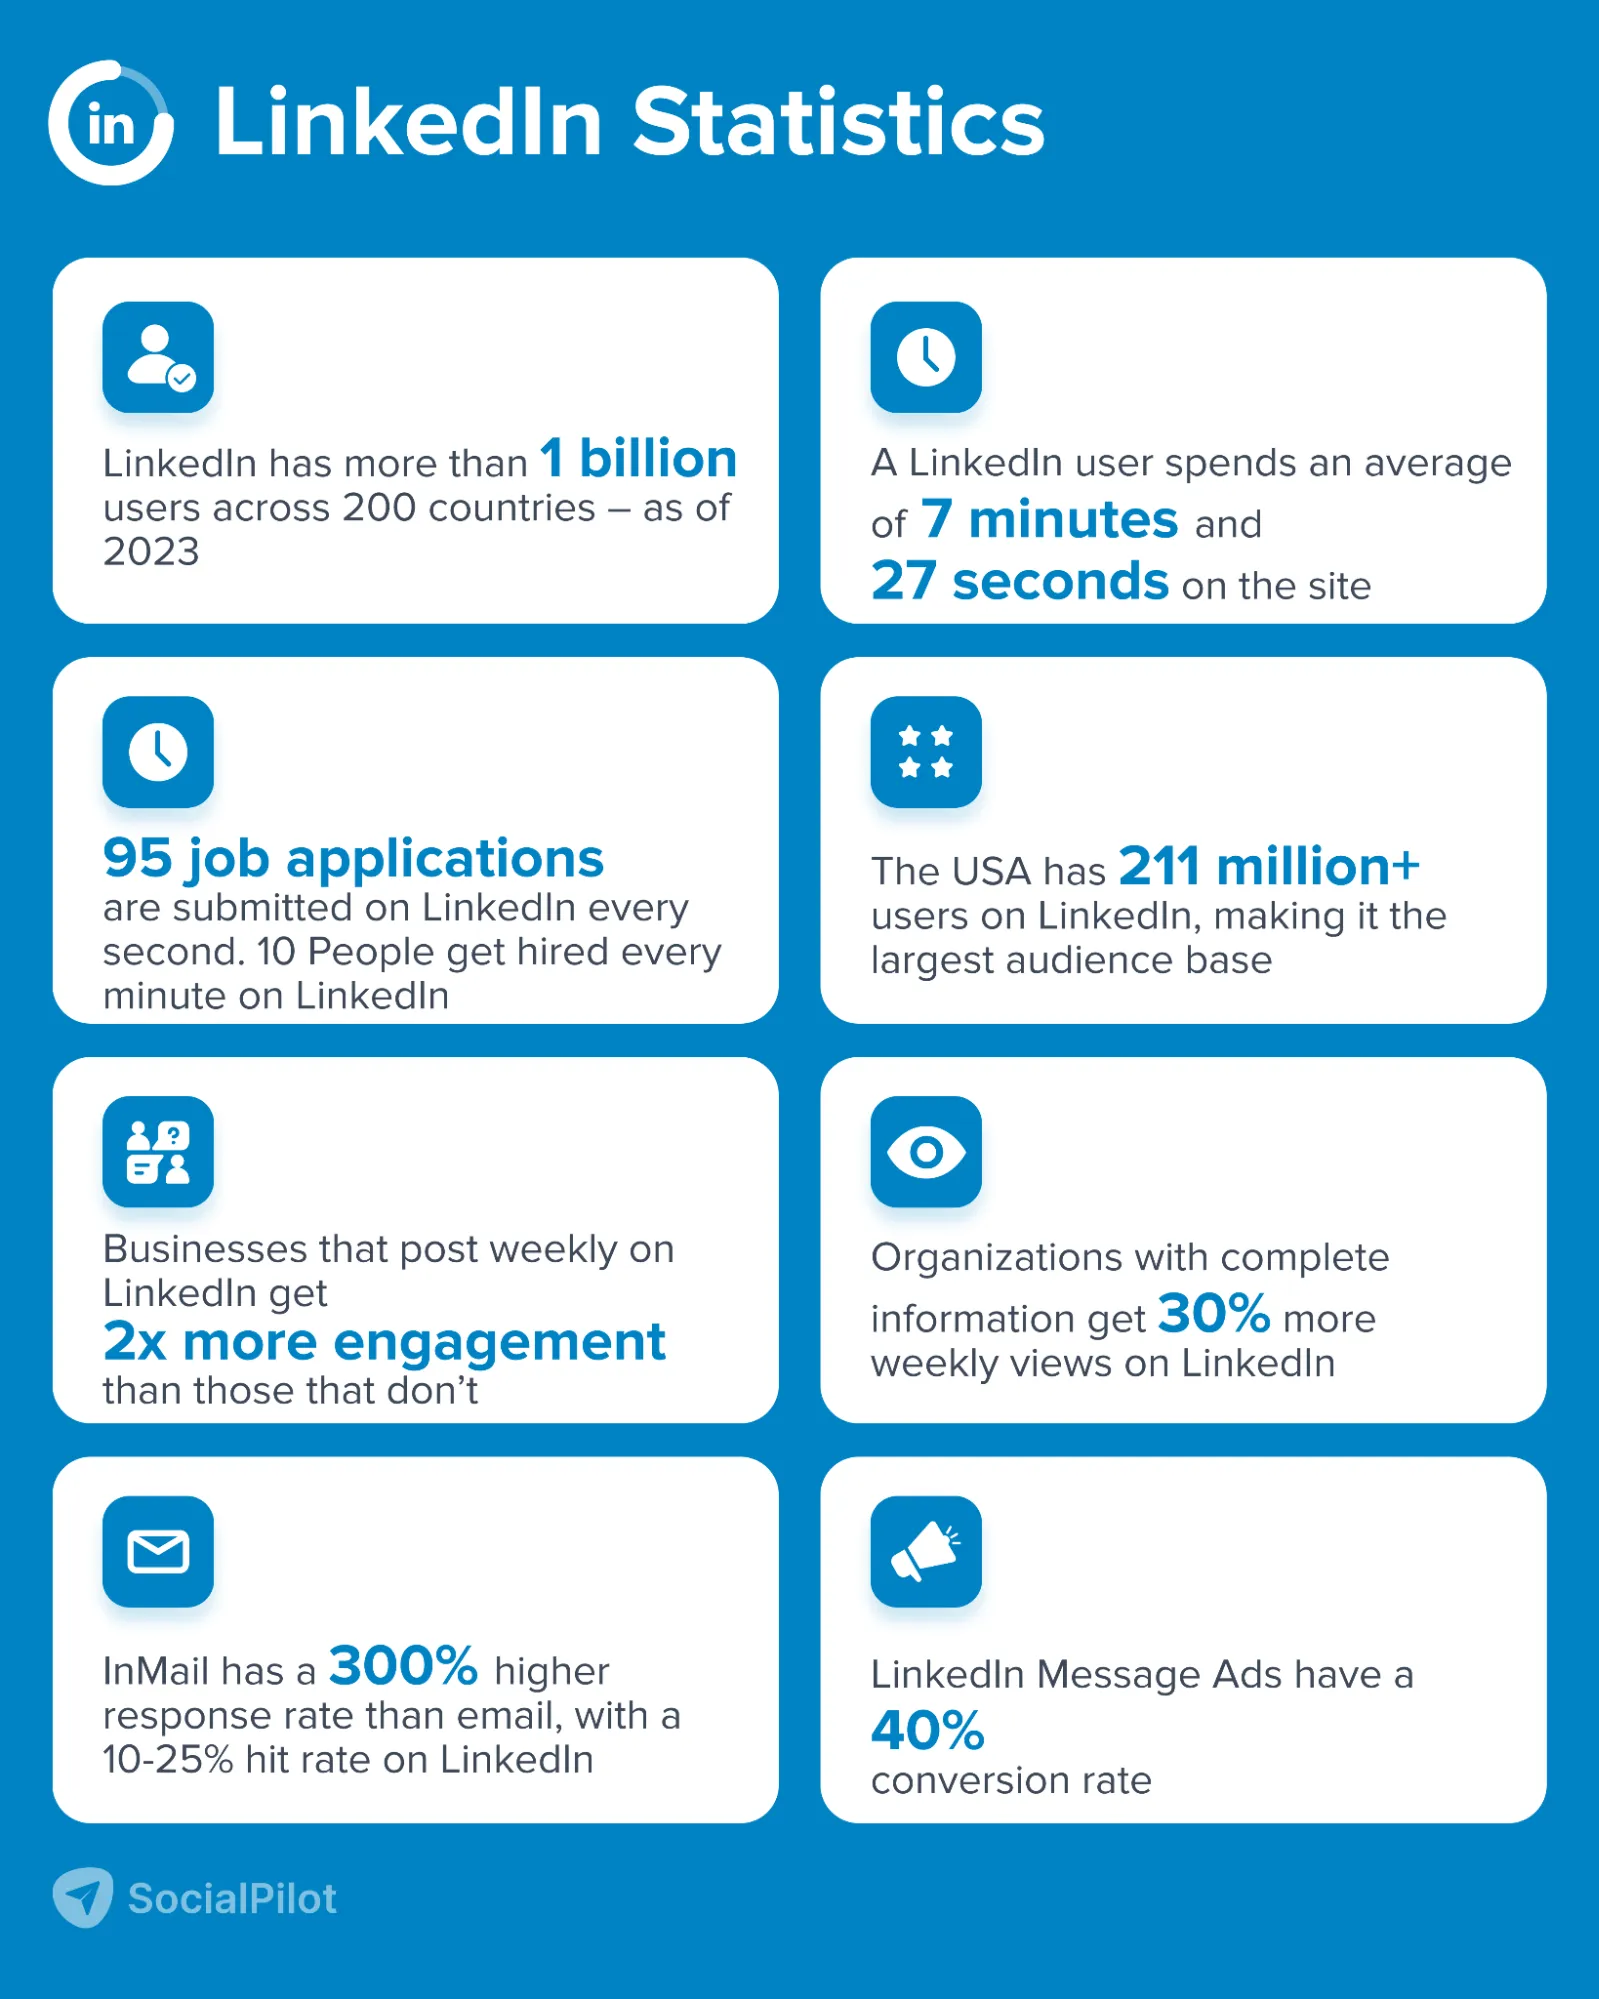
- LinkedIn has more than 1 billion users across 200 countries – as of 2023.
- LinkedIn user spends an average of 7 minutes and 27 seconds on the site.
- 95 job applications are submitted on LinkedIn every second. 10 People get hired every minute on LinkedIn.
- 50 million people use LinkedIn to look for jobs every week.
- 16.2% of US users login to LinkedIn on a daily basis, while 48.5% of the users login in monthly.
LinkedIn Demographics Stats
- USA has 211 million+ users on LinkedIn, making it the largest audience base. Followed by India with 117 million users.
- As of January 2023, 56.3% of LinkedIn users are males, while 43.7% are females.
- As of Jan 2023, 60 percent of LinkedIn users worldwide were between the ages of 25 and 34 years. 21.7% of the total user base of LinkedIn is aged 18-24.
- 52.1% of LinkedIn users from the US are men, while 47.9% are women.
LinkedIn Engagement Stats
- Businesses that post weekly on LinkedIn get 2x more engagement than those that don’t.
- 40% of LinkedIn visitors organically engage with a page each week.
- LinkedIn witnessed 15.4 billion sessions in Q2 FY22.
- Organizations with complete information get 30% more weekly views.
- Active LinkedIn members who are frequently interacting with content are 5x more likely to return each day than those who don’t.
LinkedIn Business Stats
- As of Q1 2023, more than 58 million companies are listed on LinkedIn.
- 45% of marketers have gained customers through LinkedIn.
- Lead Gen Forms on LinkedIn can increase conversions by 3x.
- According to a report, 89% of B2B marketers rely on LinkedIn for lead generation, and 62% say it generates leads successfully.
- InMail has a 300% higher response rate than email, with a 10-25% hit rate on LinkedIn.
LinkedIn Ads Insights
- As of April 2023, 922.3 million users can be reached with LinkedIn ads.
- An ad on LinkedIn can reach 16.4% of the world’s population over 18 years of age.
- Sponsored InMail has an open rate of 52% on LinkedIn.
- The US offers the largest group of LinkedIn advertising audiences, with a reach of 200 million users.
- LinkedIn Message Ads have a 40% conversion rate.
- In 2022, LinkedIn generated $5.91 billion in advertising revenue.
TikTok Statistics
Short-form videos are here to stay. For all brands targeting the Gen Z population, TikTok remains a vital channel for communication. When marketed right, your brand has the potential to go viral on TikTok and influence your audience.
Plus, with the introduction of shopping features and live streaming, TikTok has opened up even more business opportunities to drive sales.
However, advertising on TikTok can be pricey. Businesses pay up to $50,000 per day for a brand takeover. But don’t let that deter you – studies show that 61% of TikTok users are likelier to buy from a brand they see advertised on the platform.
Consider some of the vital TikTok statistics before you strategize on that next viral trend for your brand.
TikTok Usage Stats
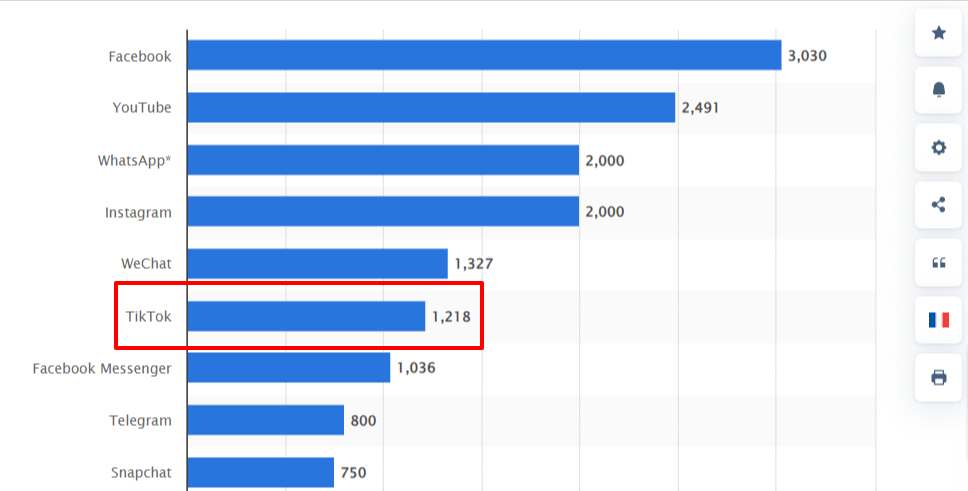
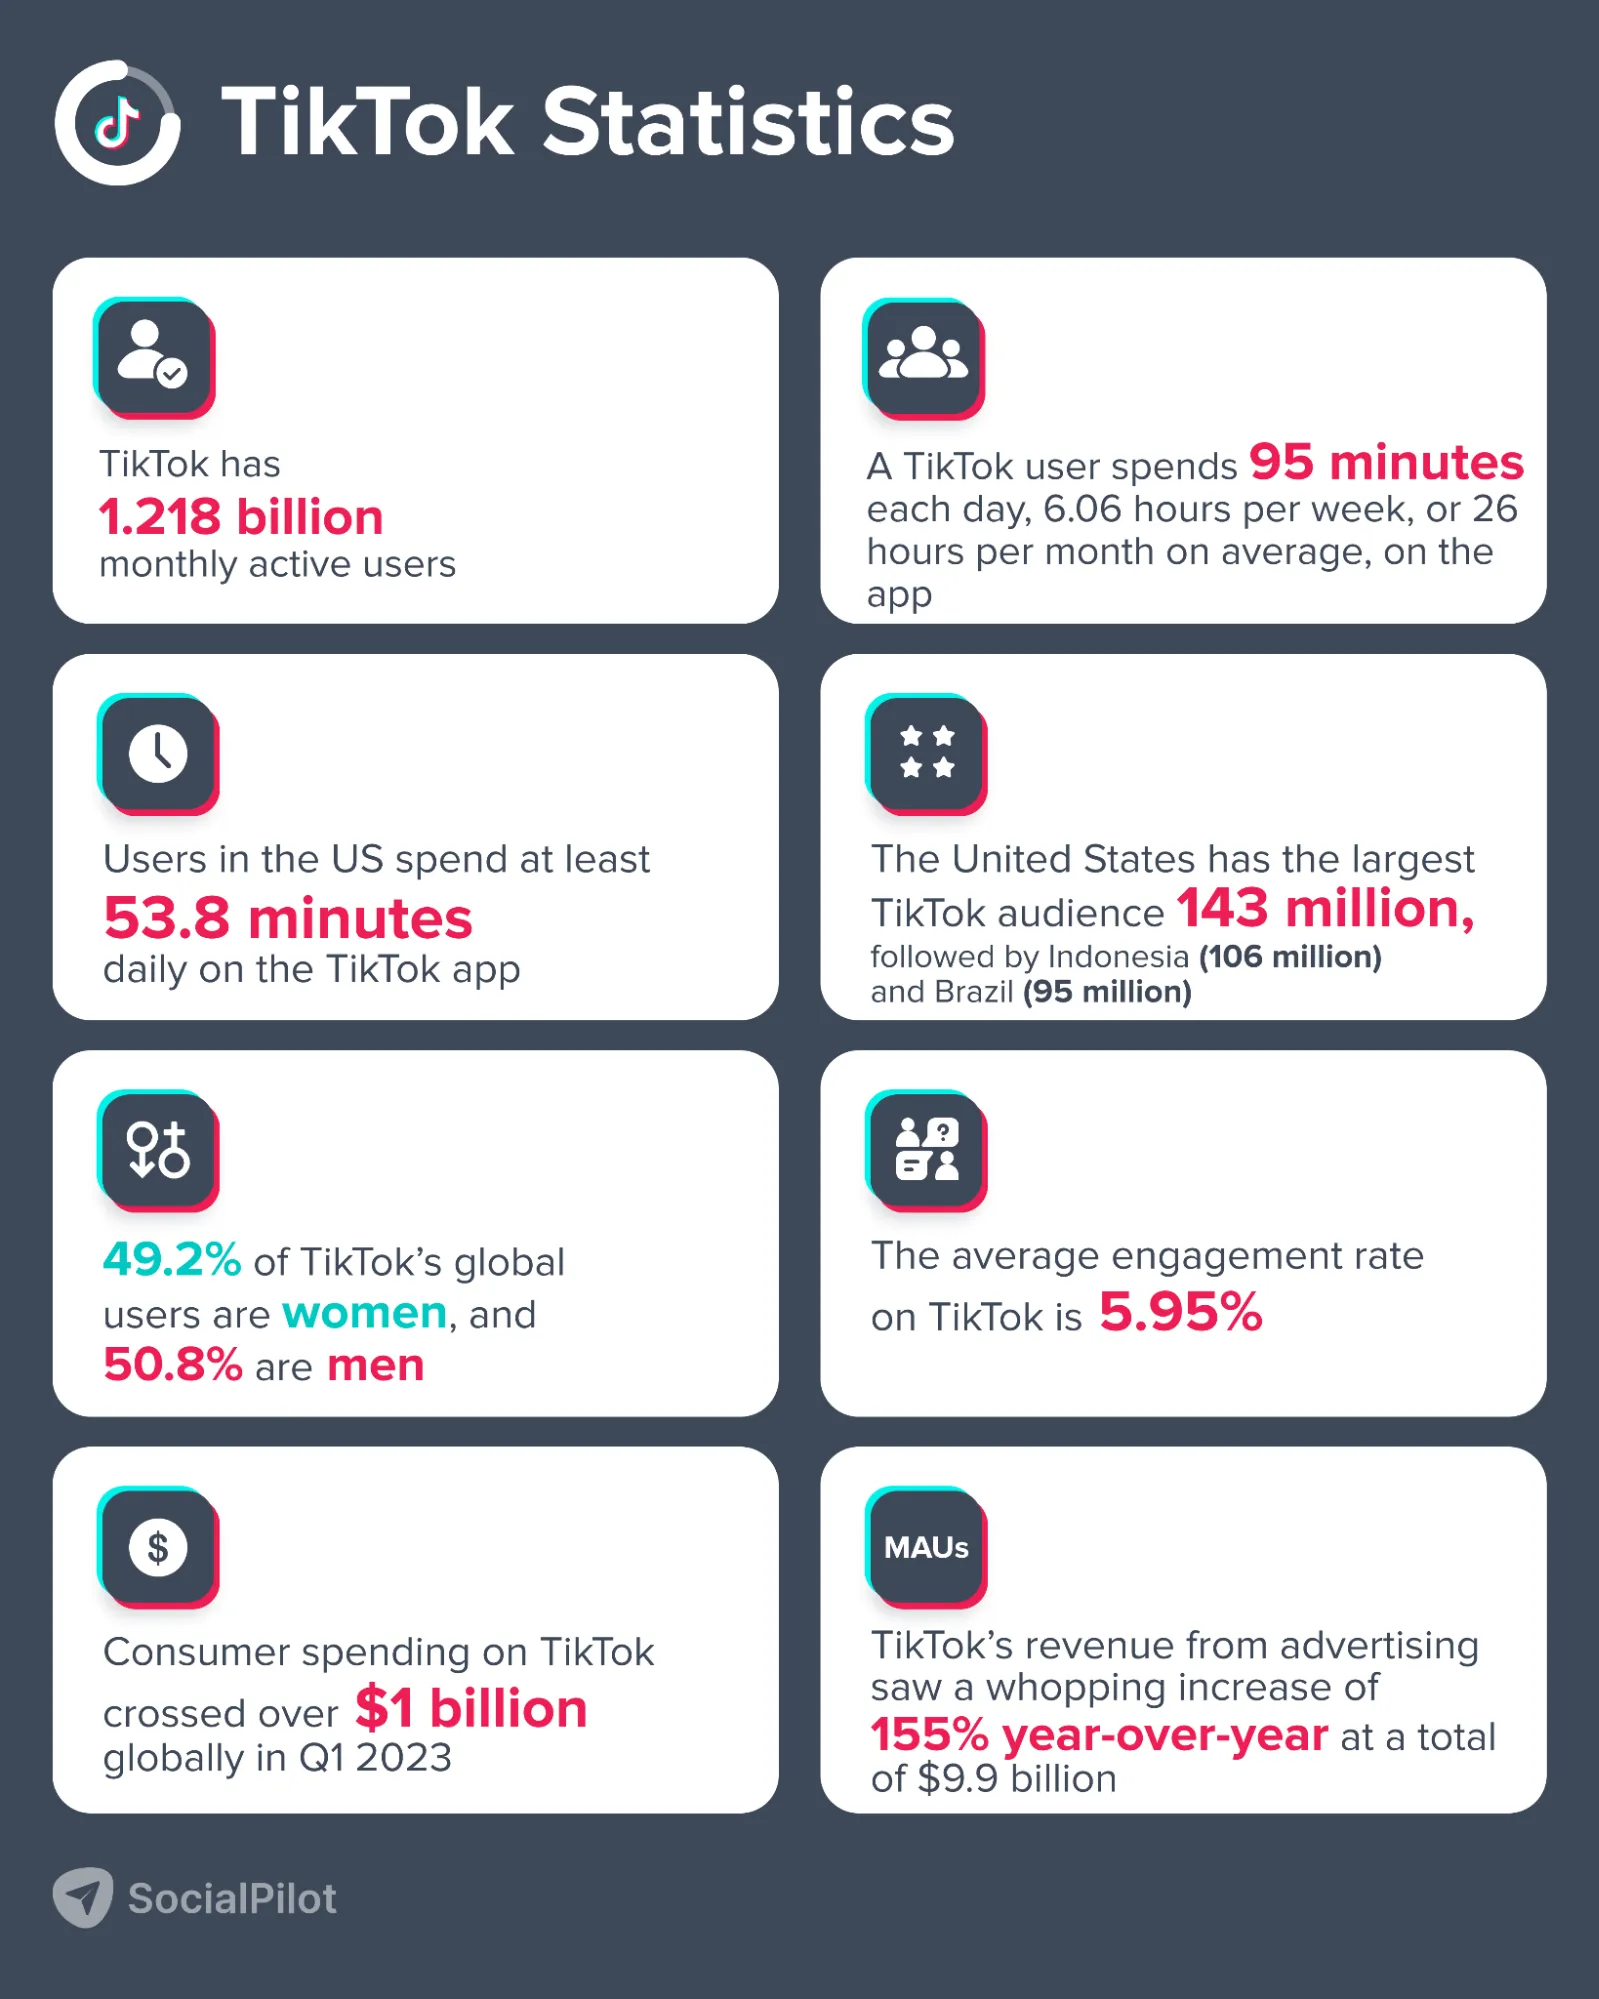
- TikTok has 1.218 billion monthly active users (MAUs).
- In Jan 2022, TikTok had over 29.7 million daily active users (DAUs) via iOS devices worldwide.
- Only 30 million monthly active users access TikTok through Android devices.
- A TikTok user spends 95 minutes each day, 6.06 hours per week, or 26 hours per month on average, on the app.
- Users in the US spend at least 53.8 minutes daily on the TikTok app.
TikTok Demographics Stats
- As of October 2023, the United States has the largest TikTok audience (143 million), followed by Indonesia (106 million) and Brazil (95 million).
- Over 38.5% or 419.9 million TikTok users are between the ages of 18 and 24, making up the largest audience group.
- 49.2% of TikTok’s global users are women, and 50.8% are men – as of Oct 2023.
TikTok Engagement Stats
- There are over 1 million+ videos viewed every day.
- The average engagement rate on TikTok is 5.95%.
- With a whopping 535 billion hashtag views, ‘Entertainment’ is the most viewed content category on TikTok.
TikTok Business Stats
- Consumer spending on TikTok crossed over $1 billion globally in a single quarter
- Brands post an average of 1-4 times per day on TikTok.
- TikTok buyers in the US increased by 72.3%, reaching a total of 23.7 million.
- Brands post an average of 1-3 times per day on TikTok.
TikTok Ads Insights
- In 2022, TikTok’s revenue from advertising saw a whopping increase of 155% year-over-year at a total of $9.9 billion.
- TikTok’s ad revenue is set to reach $17.2 billion in 2024, a 26% jump from the previous year.
- TikTok has an ad reach of nearly 885 million people.
- TikTok ads reach 17.9% of all internet users aged 18+.
YouTube Statistics
YouTube is an absolute powerhouse in video content, with over 2 billion monthly active users. That’s a massive number, isn’t it?
From hilarious BTS videos to life-changing tutorials, there’s something for everyone on YouTube. It’s no surprise why so many people flock to this platform to search for videos.
But what’s even more interesting is that YouTube is constantly evolving to keep up with the changing times. The YouTube Shorts feature, creator-focused features, and other updates are gaining immense traction among the newer generation of social media users on the platform.
If you want to leverage the power of YouTube to connect with your audience, pay attention to the below YouTube statistics.
YouTube Usage Stats
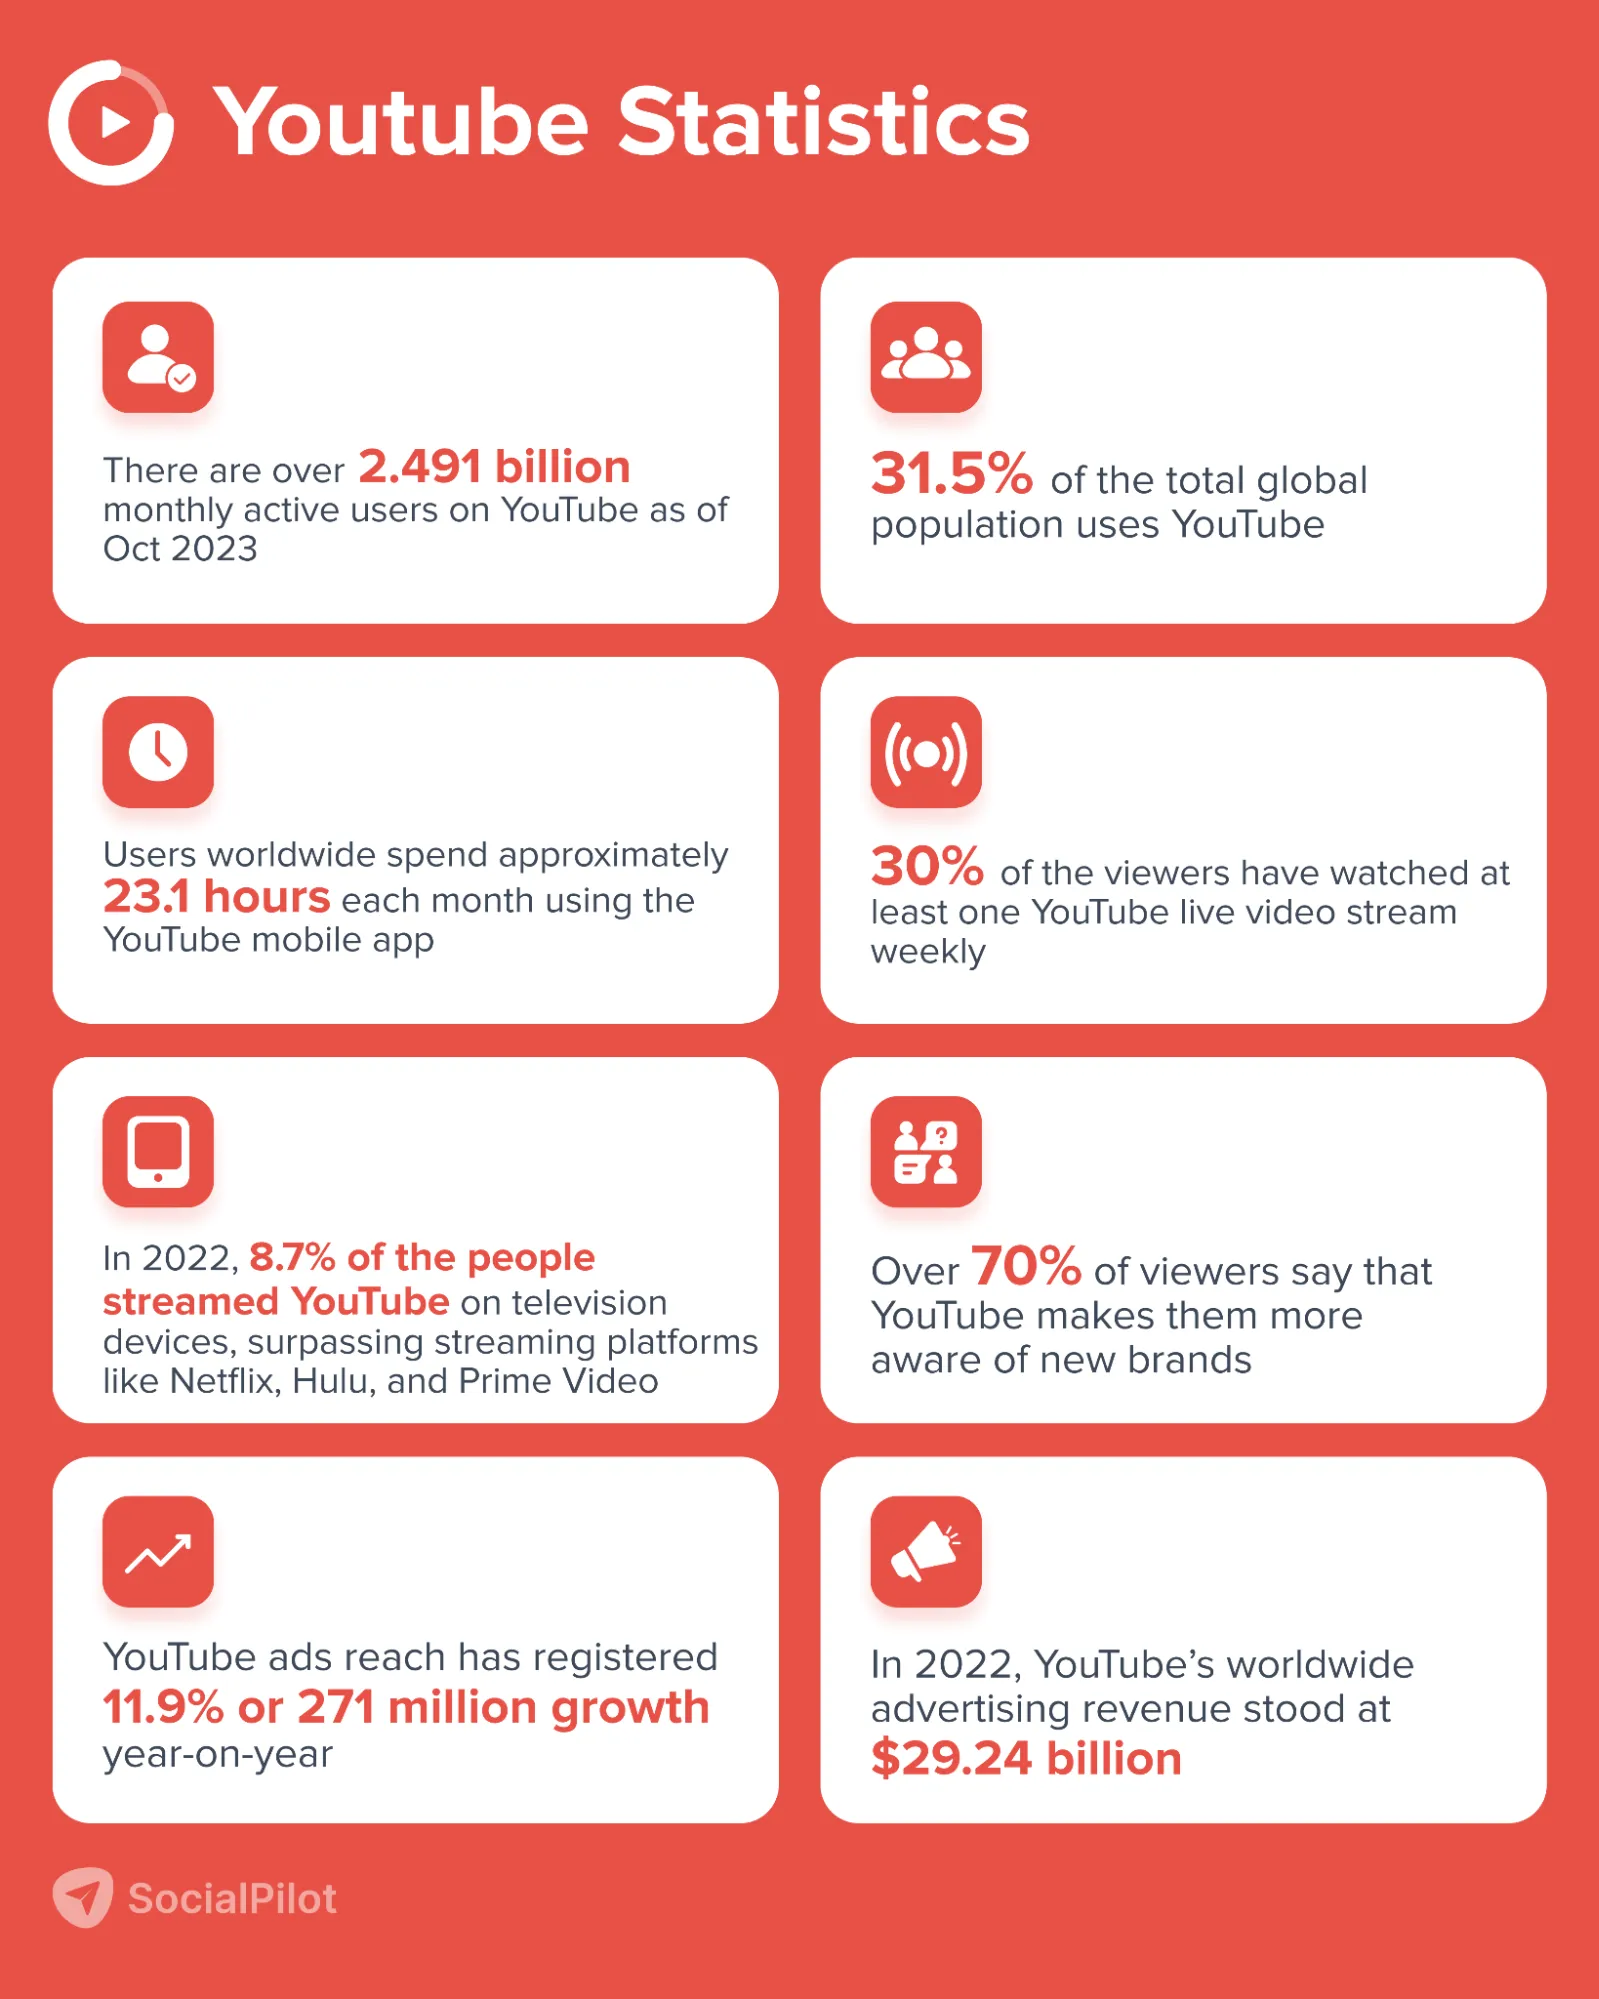
- There are over 2.491 billion active monthly users on YouTube as of Oct 2023.
- YouTube is the second most visited website after Google.
- 31.5% of the total global population uses YouTube.
- As of June 2022, Over 500 hours of new content are uploaded to YouTube every minute.
- In November 2022, YouTube had approximately 71.66 billion visits from mobile users and over 8 billion from desktop users.
- Users worldwide spend approximately 23.1 hours each month using the YouTube mobile app.
- In March 2021, users worldwide spent an average of 29 minutes and 37 seconds per user per visit on YouTube.
- In 2022, YouTube Shorts hit an all-time high of 5 trillion views.
YouTube Demographics Stats
- As of Oct 2023, India has the most prominent YouTube audience of 462 million, followed by the US with 239 million, Brazil with 144 million, and Indonesia with 139 million viewers.
- 54.4% of YouTube users are men, and 45.6% are women as of Oct 2023.
- 12.2% of YouTube’s global audience aged 25-34 years old is male, and 9% is female.
- An online survey conducted in May 2022 revealed that 96% of Gen Z users have a YouTube account, while 87% of millennials are registered on the video platform.
- YouTube is the world’s second-most visited website, with more than 74.8 billion monthly visits.
YouTube Engagement Stats
- In the past 12 months, video watch time has grown by 270%.
- 30% of the viewers have watched at least one live video stream weekly.
- Over 1,000 years of watch time has been recorded for “shopping spree” videos in the past two years.
- Watch time for “wildlife videos” increased by 40% last year.
YouTube Business Stats
- Nielsen reports that in 2022, YouTube accounted for 8.7% of total TV usage, surpassing other streaming platforms such as Netflix, Hulu, and Prime Video.
- 33% of shoppers have reported purchasing products they discovered on YouTube.
- Over 70% of viewers say that YouTube makes them more aware of new brands.
YouTube Ads Insights
- YouTube ads have the potential to reach 2.491 billion users globally.
- YouTube ads reach has registered 11.9% or 271 million growth year-on-year.
- About 46% of the 2.09 billion users are women and men account for 53.9% of the total YouTube ad reach for 18+.
- In 2022, YouTube’s worldwide advertising revenue stood at $29.24 billion, a nearly 2% jump from the previous fiscal year.
Pinterest Statistics
Over the last year, Pinterest has actively grown more inclusive and creator-friendly. We saw new features for the beauty industry, like expanded search options based on skin tone and hair type.
Shopping on Pinterest also became easy with features like Live Shopping and shoppable Idea Pins. Last year, Pinterest pushed the envelope by adding more personalized shopping features like “Your Shop.”
We can say that Pinterest is not just an essential platform for driving website traffic but also a branding and e-commerce platform. Pay attention to these Pinterest statistics before planning your marketing and SEO strategy using Pinterest tools.
Pinterest Usage Stats
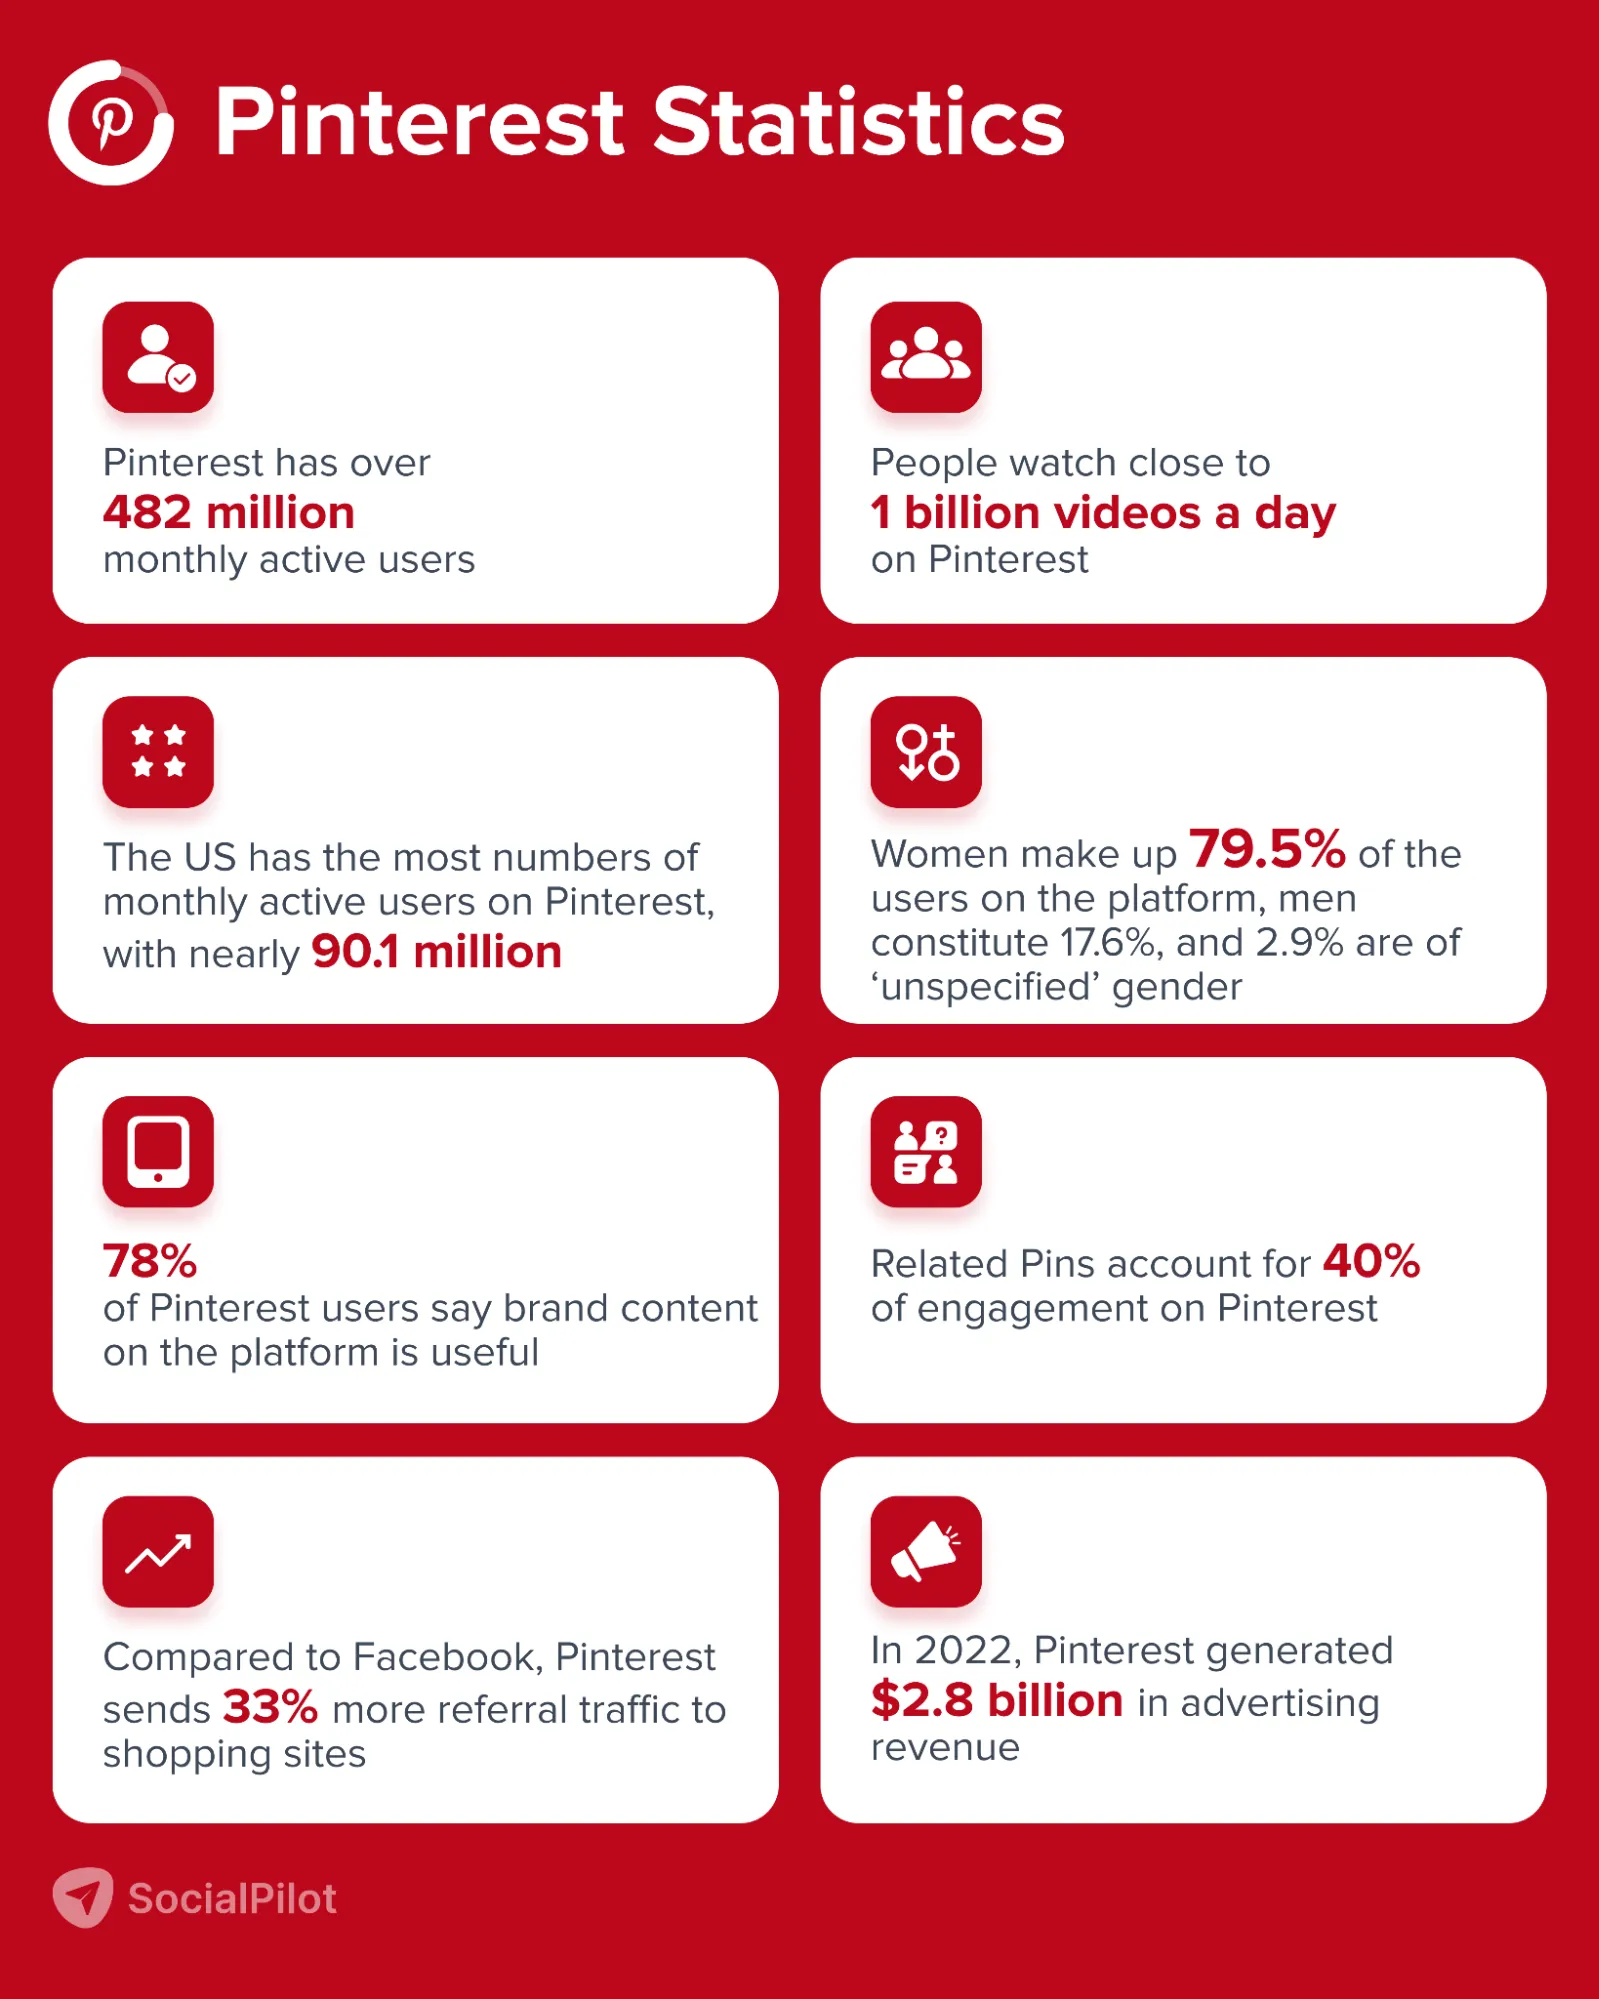
- Pinterest has over 482 million monthly active users.
- More than 5 billion searches happen on Pinterest each month.
- People watch close to 1 billion videos a day on Pinterest.
- High-income households are twice as likely to use Pinterest as low-income households.
Pinterest Demographics Stats
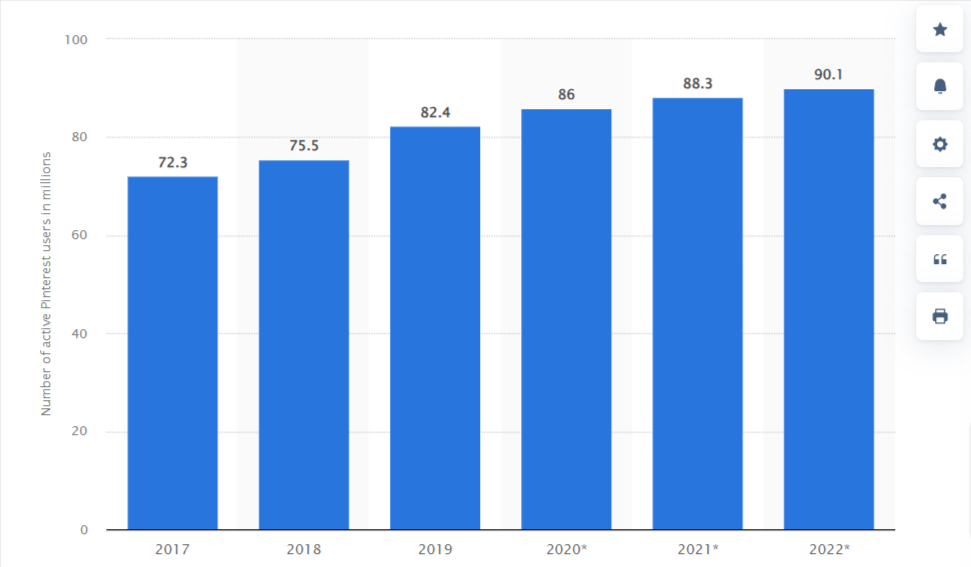
- There are 90.1 million monthly active Pinterest users in the United States, followed by Brazil (34.2 million), and Mexico (23.6 million).
- 45% of people in the US with household income over $100K are on Pinterest.
- 7.4% of all people aged 13+ years use Pinterest.
- 44% of the platform’s traffic comes from the US.
- Women make up 79.5% of the users on the platform, while men constitute 17.6% of the users and 2.9% are of ‘unspecified’ gender.
- 31% of millennials in the UK with a household income of over £100K are on Pinterest.
Pinterest Engagement Stats
- Pinterest trends outperform other internet trends by 21% each month.
- 89% of US pinners use Pinterest for inspiration to make purchase decisions.
- Related Pins account for 40% of engagement on Pinterest.
- Pinterest has an average of 554 pins per pinner.
- According to 78% of Pinterest users, brand content on the platform is useful.
Pinterest Business Stats
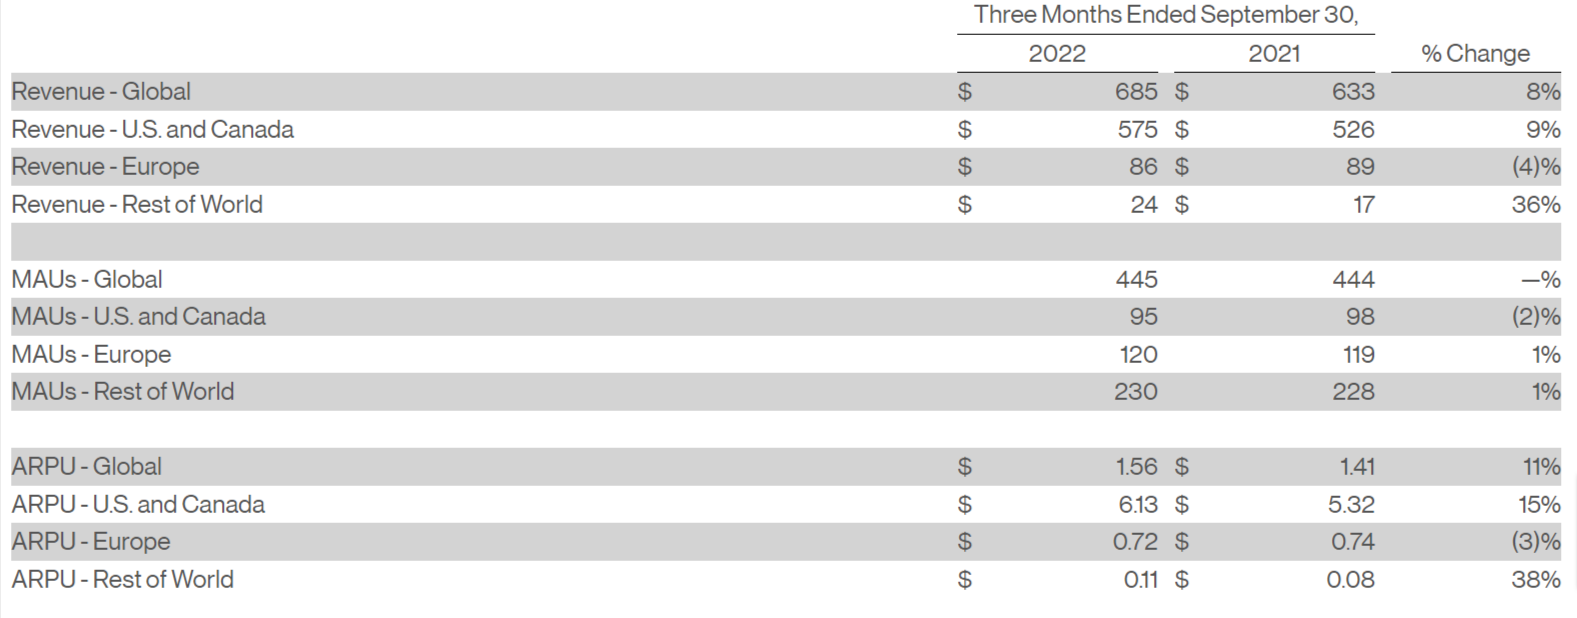
- In Q3 2022, Pinterest generated $685 million in revenue, of which $575 million came from the US and Canada alone.
- Compared to Facebook, Pinterest sends 33% more referral traffic to shopping sites.
- 97% of all searches on Pinterest are unbranded.
- For every $1 spent on Pinterest marketing, sales are generated at a rate of $4.30.
Pinterest Ads Insights
- On Pinterest, advertisers may reach more than 282.5 million users.
- 61% of Pinterest users have purchased after seeing a sponsored pin.
- Pinterest ads have the potential to reach 3.5% of the global population.
- In 2022, Pinterest generated $2.8 billion in advertising revenue.
- Compared to other social platforms, Pinterest’s shopping advertisements generate 2.3x as many conversions and a 2x increase in the positive incremental return on ad expense.
Snapchat Statistics
To remain relevant, Snapchat has been restructuring and introducing a host of features. Snapchat has recently made an entry on big desktop screens. Plus, Snapchat+ (subscription-based) is continuously evolving with new add-on elements.
In addition, Snapchat’s TikTok-like feature, Snapchat Spotlight, keeps users engaged with the platform. If your marketing plan does not include Spotlight, it is time to restrategize.
Perhaps these Snapchat statistics will convince you to integrate the platform into your marketing strategy.
Snapchat Usage Stats
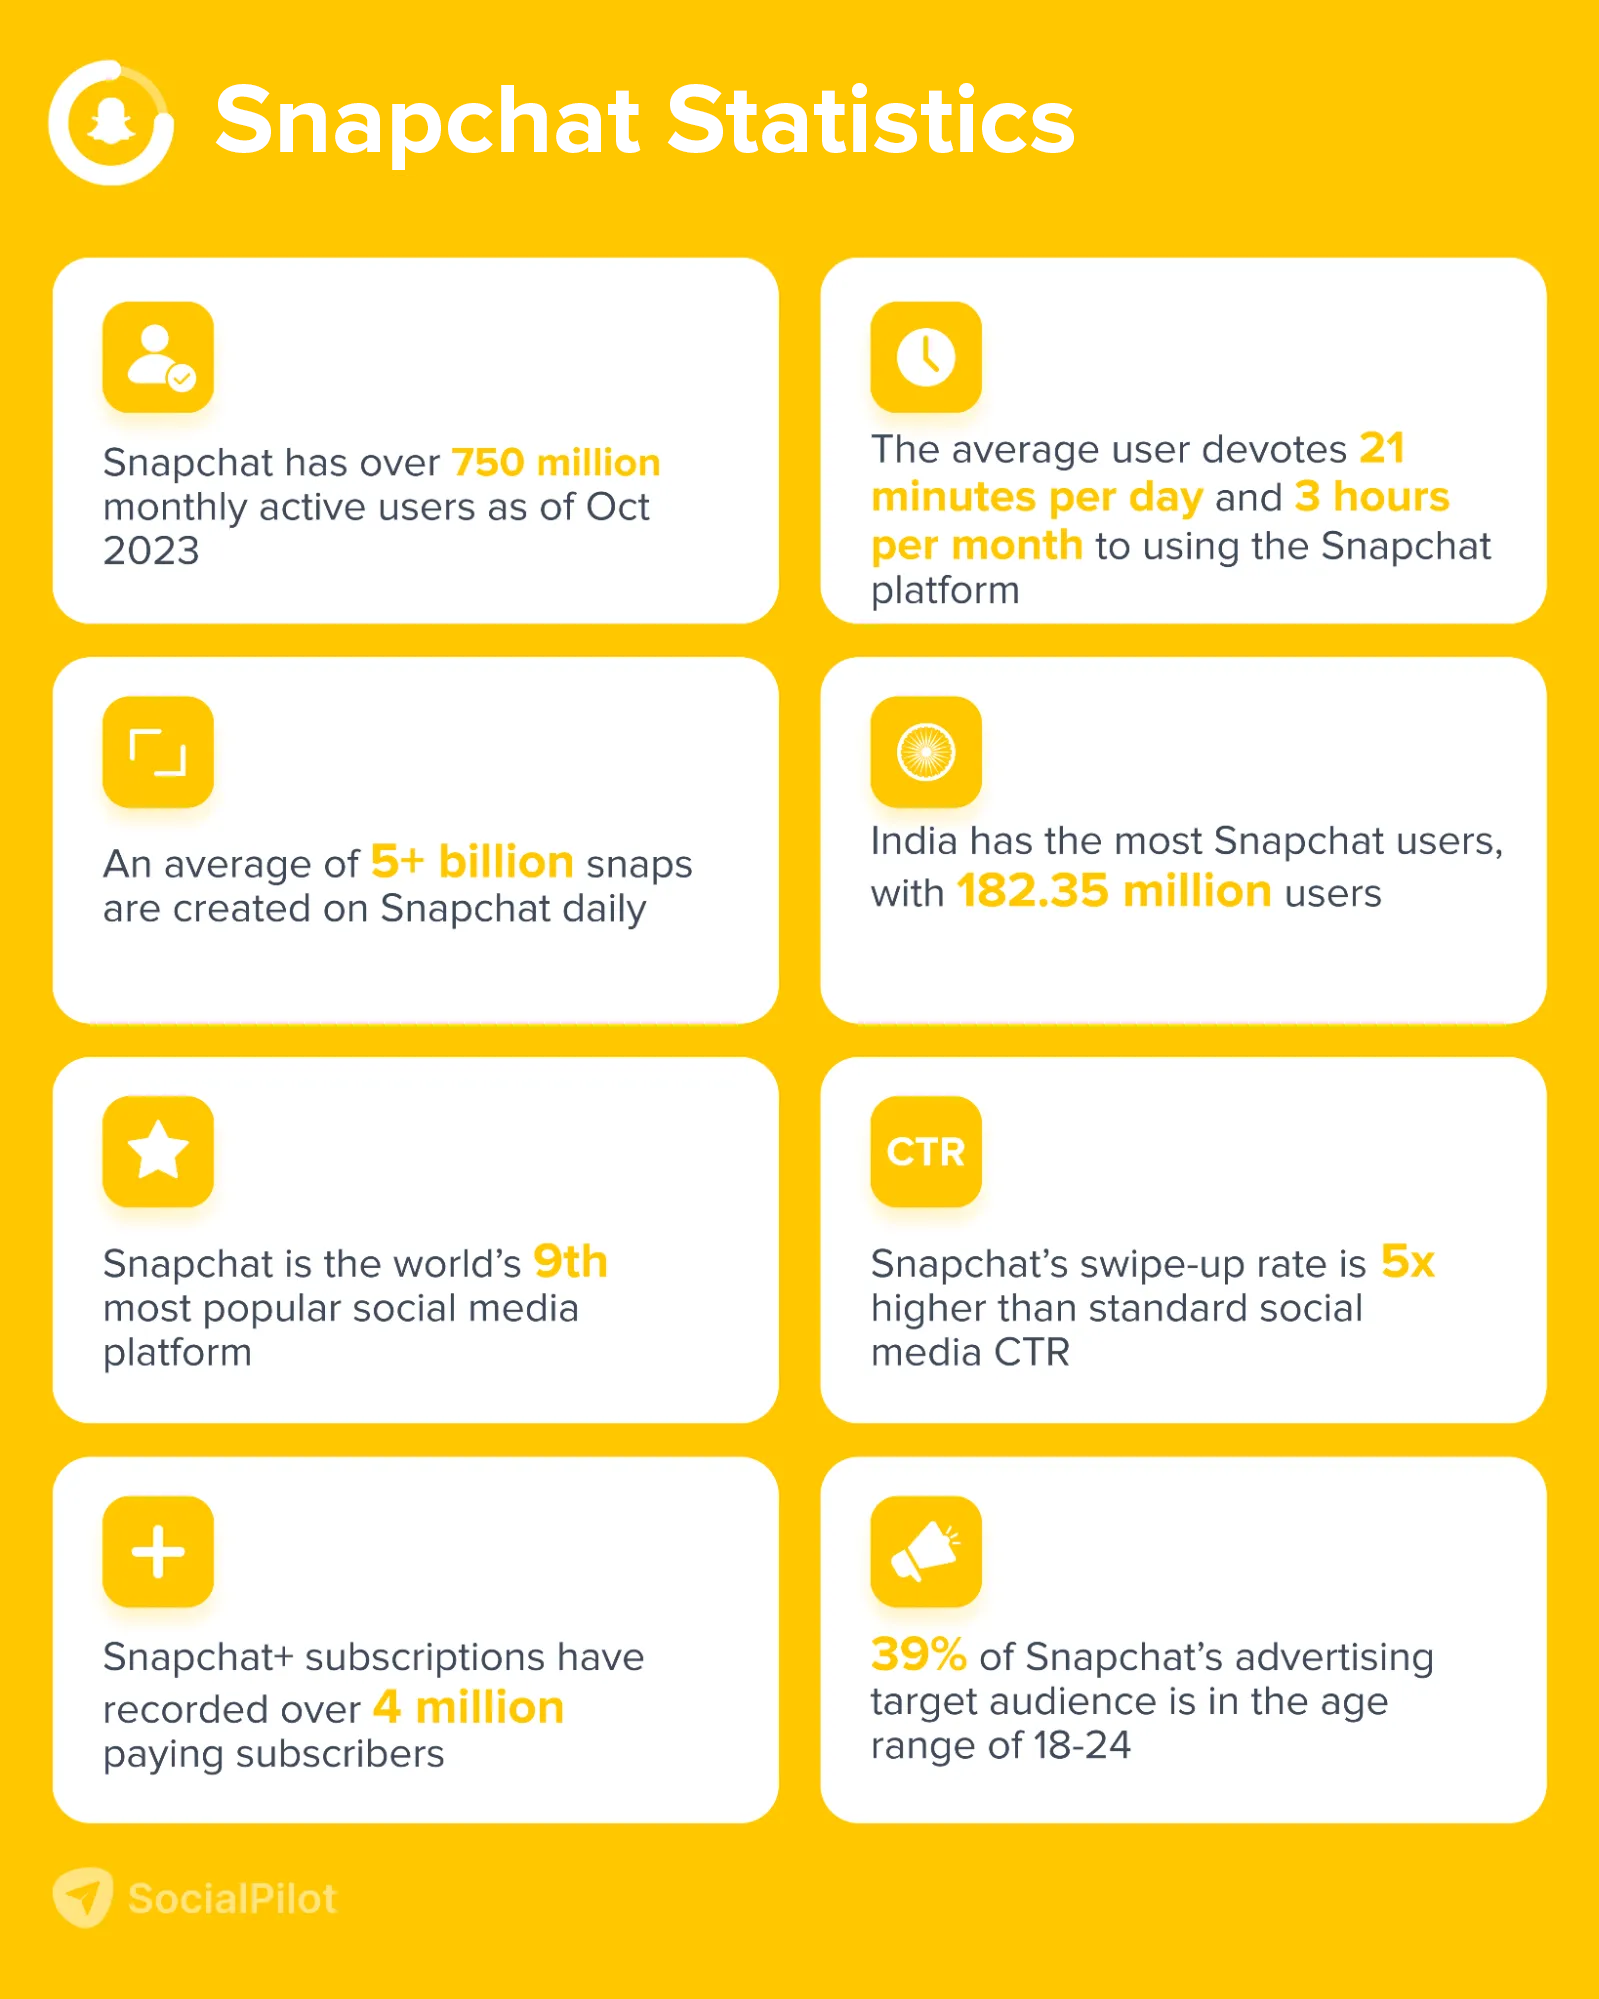
- Snapchat has over 750 million monthly active users as of Oct 2023, a big jump from 600 million in April 2022.
- Snapchat’s daily active users worldwide have increased to 397 million, up from 383 million in Q1 2023.
- The average user devotes 21 minutes per day and 3 hours per month to using the Snapchat platform.
- An average of 5+ billion snaps are created on Snapchat daily.
Snapchat Demographics Stats
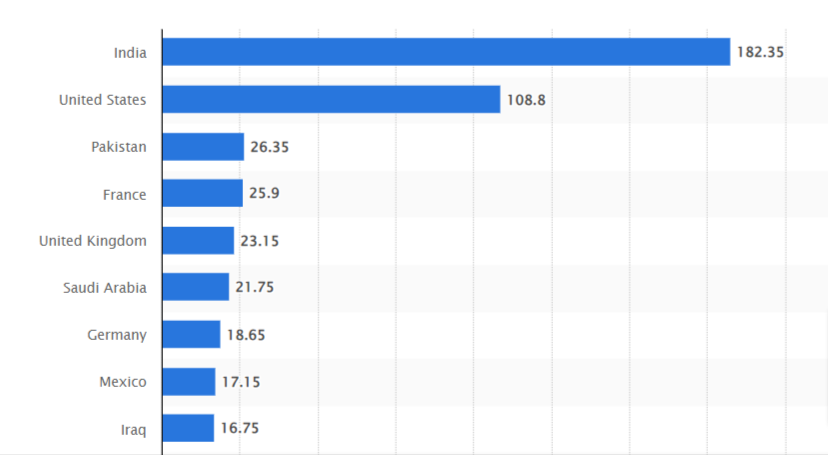
- India has the most extensive Snapchat user base, with a total of 182.35 million users, followed by the US (108.8 million), Pakistan (26.35 million), and France (25.9 million) as of April 2023.
- Snapchat is the world’s 9th most popular social media platform.
- 1.4% of internet users aged 16 to 64 call Snapchat their favorite social media app.
- Females comprise 51%, and males account for 48.2% of Snapchat’s global user base.
Snapchat Engagement Stats
- The number of Snap Stories that include music has increased by over 3X.
- Since January 2021, over 250 million Snapchat users have used AR shopping lenses more than 5 billion times.
- Snapchat’s swipe-up rate is 5x higher than standard social media click-through rates.
- More than 300 million users interact with Spotlight content each month.
Snapchat Business Stats
- Snap Inc. generated $1.13 billion in revenue for Q3 of 2022, a 6% increase from the previous year, with a significant portion coming from the US market.
- Together, millennials and Gen Zs have a spending power of over $1 trillion, and Snapchat’s user base has a combined spending power of $4.4 trillion.
- Snapchat+ subscriptions have recorded over 4 million paying subscribers.
- Snapchat users are 60% more likely to make impulse purchases.
Snapchat Ads Insights
- Advertisers can reach 654.4 million people on Snapchat – as of April 2023.
- 39% of Snapchat’s advertising target audience is in the age range of 18-24.
- As of Jan 2023, 50.6% of Snapchat’s advertising audience is female, and 48.7% is male.
- Snapchat ads that are 5 to 6 seconds long perform the best.
- In 2022, Snapchat generated an estimated $4.6 billion in advertising revenue, which is expected to grow to $8.34 by 2027.
Conclusion
Navigating today’s digital landscape requires a keen understanding of current social media trends, from Gen Z preferences to B2B shifts. Marketers can tailor strategies to evolving user behaviors by harnessing vital social media marketing facts.
Harness tools like SocialPilot to track and adapt to these trends, ensuring your strategies resonate with the ever-evolving digital audience. Elevate your digital game with data-driven decisions and stay ahead in the social media landscape.
Supercharge your social media strategies with informed decision-making, starting today!


