Twitter has changed. Or should we say X?
Whether you’re a brand, creator, or social media strategist, understanding how this fast-paced platform is evolving in 2025 is non-negotiable. From shifting user demographics and ad trends to engagement metrics that really matter—there’s a lot happening behind the scenes.
And numbers? They tell the full story.
That’s why we’ve pulled together 60+ Twitter statistics that break down exactly how people use the platform, when they engage, who’s actually tuning in, and what’s working for businesses right now.
X (Twitter) Usage Statistics
Before you plan your next tweet or schedule a campaign, it’s important to know how people are actually using the platform. Twitter—or X—isn’t just a space for breaking news and trending memes anymore. It’s a dynamic ecosystem with millions of daily conversations, loyal users, and surprising shifts in behavior.
In this section, we’ll look at how active the platform really is in 2025, who’s showing up, and what kind of time they’re spending there. Spoiler: usage is far from declining.
Let’s dig into the numbers.
- X/Twitter has 611 million monthly active users.
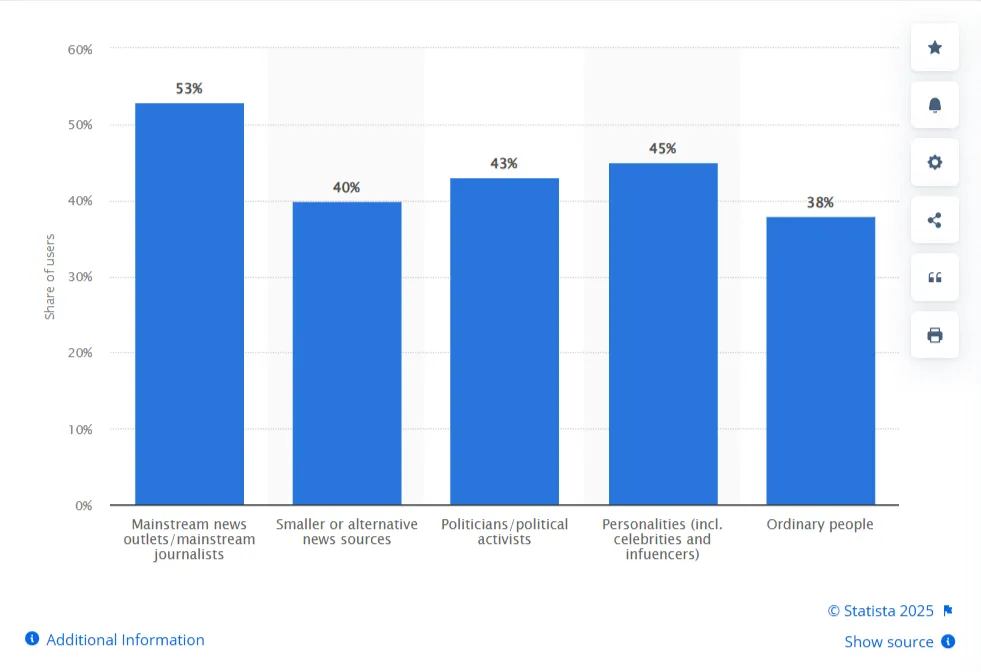
- 53% of X/Twitter users pay attention to Mainstream news outlets, while 45% pay attention to Personalities.
- X/Twitter has over 245 million daily active users.
- X/Twitter reaches 12.6% of Internet users globally.
- In the US alone, X/Twitter has over 50.5 million monthly active users.
- Here’s a table to show how X/Twitter platform is being used by various countries:
United States 111.3 million Japan 75.8 million India 27.3 million Indonesia 27.1 million United Kingdom 25.9 million Brazil 22.9 million Turkey 21.1 million Mexico 18.8 million France 17.5 million Saudi Arabia 17.4 million - Over 500 million tweets are posted daily.
- 125 million hashtags are tweeted every day.
- Over 5 million spaces were created in 2024.
- The posts on X/Twitter get about 100 billion impressions daily.
- X/Twitter ranked 11th among the world’s most popular social networks.
- Around 1.5 million people signed up for X/Twitter daily.
- 7.8 billion total minutes spent on X/Twitter Daily.
- 70,000 people join new communities on X/Twitter daily.
Sources: Search Logistics, Global Content Users Statista, Backlinko, World Population Review, Measure Studio, Analyzify
X (Twitter) Demographics Statistics
Knowing who’s on Twitter is just as important as knowing how they use it. Demographics shape everything—from the tone of your content to the timing of your posts.
In 2025, Twitter’s user base spans across age groups, regions, income levels, and interests—making it a goldmine for brands that understand their audience. Whether you’re targeting Gen Z trendsetters or professionals in their 30s, these numbers will help you refine your strategy.
Let’s break down who’s really scrolling through X right now.
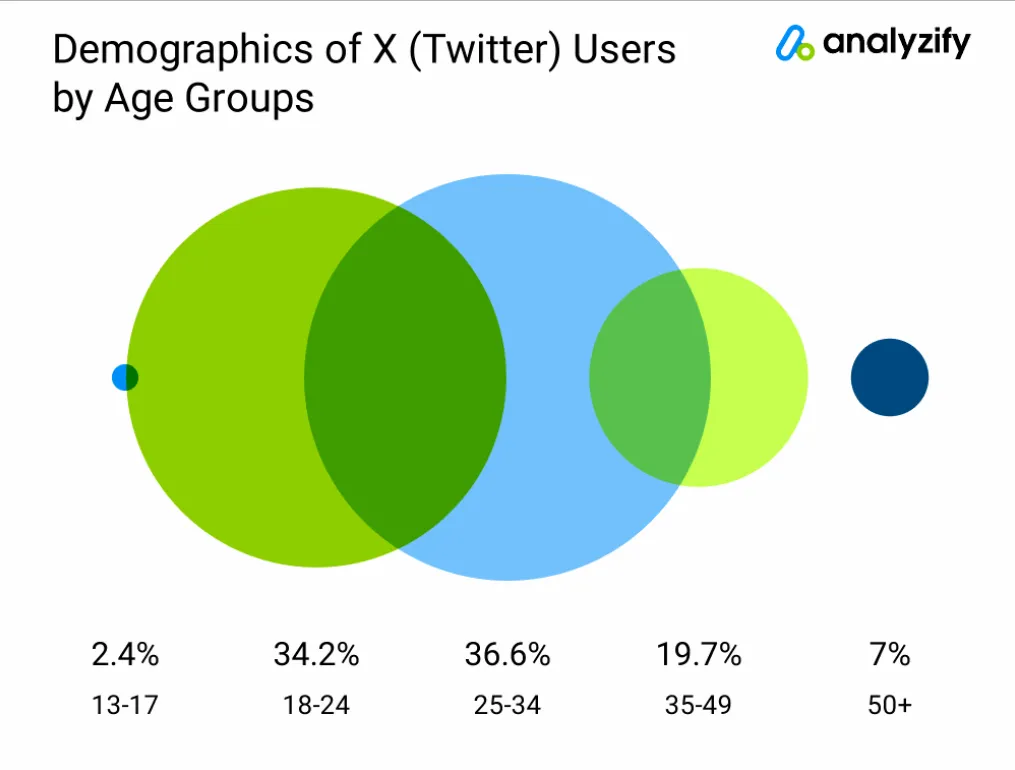
- 36.6% of X/Twitter users were in the range of 25-34 years old, 34.2% were in 18-24, 2.4% were in 50 and above.
- 63.7% of global X/Twitter users were male and 36.3% were female.
- As per 2025, 69.3% of X/Twitter users are also on Discord, while 66.4% of users are on Reddit.
- 17% of the US teens are on X/Twitter.
- Globally, 2.4% of Teens are on X/Twitter.
- 22% of the US adults are on X/Twitter.
- 29% of the US adults with an income of $100,000+ are on X/Twitter.
- 41% of X/Twitter users in the UK are from high-income households, while 32% are from medium-income households.
- The total time spent on X/Twitter has increased by 9.5%.
- 39% of parents use X/Twitter.
- The average X Premium subscriber spends 3x longer time on the X/Twitter platform.
- 93% of the UK population are aware of X/Twitter.
- X/Twitter has 1.5x more monthly active users who are students compared to other social platforms.
- 235 million X/Twitter users are interested in Dogs and 41.6 million users are interested in Cats.
- The average user opens an X/Twitter app 120.4 times per month.
- Japan opens the X/Twitter app 211.1 times, Indonesia 194.5 times, and Finland 181.2 times.
- 81% of users are on the X/Twitter platform for entertainment.
Sources: Analyzify, Hootsuite, Exploding Topics
X (Twitter) Engagement Statistics
Getting seen is great—but getting clicks, comments, and shares? That’s where the real magic happens.
In 2025, engagement on Twitter (or X) looks a little different. From the rise of video content to the sweet spot for tweet frequency, the way users interact with posts is evolving fast. For marketers and brands, understanding these patterns is key to turning impressions into impact.
So, if you’re wondering what’s working and what’s not—these engagement stats have the answers.
- X/Twitter has experienced a 35% year-over-year increase in global ad engagement.
- 82% of B2B marketers use X/Twitter.
- 79% of users follow brands on the X/Twitter platform.
- X/Twitter utilizes 61 posts/week with impressions up to 2,121 per post.
- The average organic engagement rate is 1.7% for the entertainment and media industry.
- The lowest engagement rate is 0.9% for consumer goods retails, marketing agencies, and real estate.
- The average engagement rate per tweet is 0.029%.
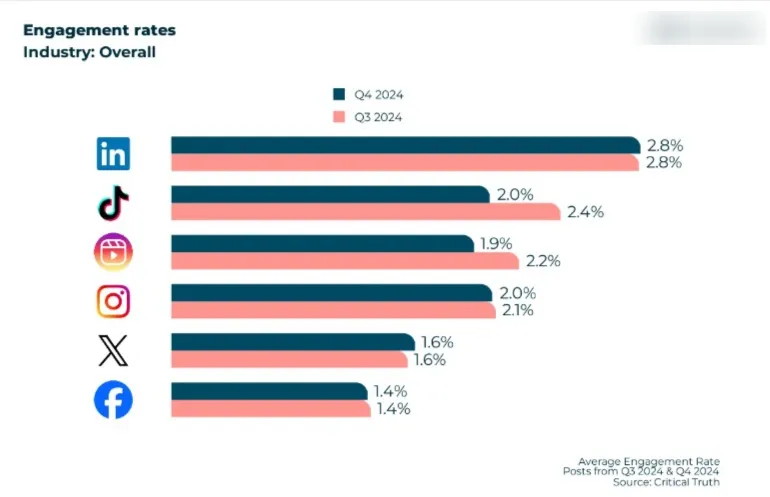
- The overall engagement rate across all industries is 2.8%.
- The optimum number of posts/week for minimum engagement is 6.
- The best time to post on X/Twitter is Tuesday between 3am and 6am.
- The overall weekly follower growth rate is 0.11% on X/Twitter platform.
- Video tweets see 10x more engagement than text-only posts.
- Retweets account for 50% of total platform interactions.
- 9.9% of influencer campaigns use X/Twitter.
- Around 1% of tweets hit the maximum character count.
- Users can post up to 2.4k times daily.
Sources: Social Shepherd, Hootsuite, Measure Studio
X (Twitter) Business Statistics
From brand awareness and customer service to product launches and real-time engagement, businesses of all sizes continue to leverage X in strategic ways. In 2025, the platform’s business dynamics reflect both challenges and opportunities, shaped by evolving user behavior and advertising shifts.
This section uncovers key business-related statistics that highlight how companies are using Twitter to connect, convert, and grow.
- X/Twitter has reportedly regained a $44 billion valuation.
- The website traffic was 23.21% from the US, 16.06% from Japan, and 5.51% from the UK was recorded between October 2023 to March 2024.
- The global X/Twitter traffic was 6.2 billion visits in March.
- The company generated $2.5 billion.
- 26% of marketers have plans to reduce ad spends on X/Twitter in 2025.
- 1k employees work at X/Twitter.
Sources: NY Post, Electro IQ, Kantar, Backlinko
X (Twitter) Ads Statistics
Ads on Twitter? They’re not just flying by unnoticed anymore.
In 2025, advertising on X is less about shouting into the void and more about smart targeting, scroll-stopping content, and timely engagement. Whether you’re working with a tight budget or scaling big campaigns, the platform offers plenty of room to play—if you know the numbers.
Here’s what the latest Twitter ad stats reveal about what’s working, what’s changing, and where the real ROI lives.
- In 2025, X’s US ad revenue is expected to grow 17.5% to $1.31 billion.
- Global ad sales on X/Twitter is set to rise 16.5% to $2.26 billion.
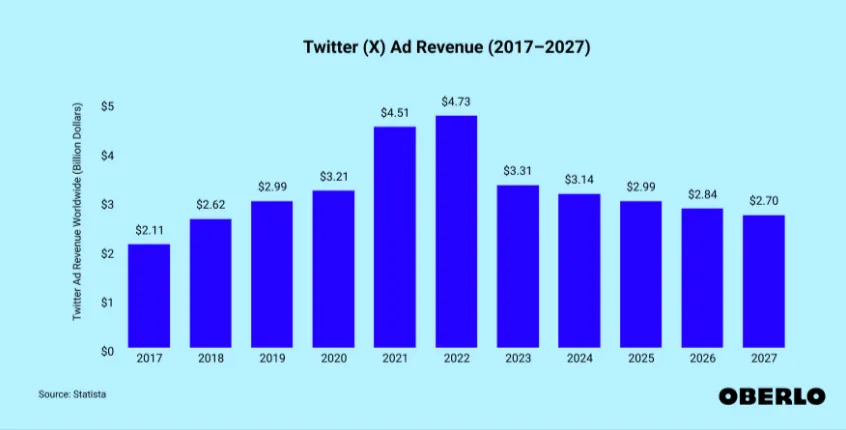
- Annual Ad revenue is $2.99 billion with potential ad reach is 586 million.
- Average ad cost is $0.26 – $1.50 with a typical monthly ad spend of $101 – $500.
- Photo posts have an engagement rate of 0.08%.
- Video posts have an engagement rate of 0.42% and Text saw an engagement rate of 0.1%.
- The United States led influencer engagement rate is 37 billion.
- There were 640k X Premium subscribers.
- X/Twitter has more than 750 premium content producers.
- Each day around 150k new long-form posts are published on X/Twitter with 3 billion impressions.
Sources: Reuters, Oberlo, Sprout Social, Premium Subscriber Statista, Analyzify
Conclusion
Twitter’s evolution into X is backed by data that speaks volumes. Whether you’re tracking user trends, optimizing ad spend, or dialing in engagement—staying ahead means staying informed.
And if you’re looking for the perfect sidekick to manage it all? SocialPilot is your go-to platform. From scheduling tweets to tracking performance and managing multiple accounts, we make social media management effortless.
Smarter strategies start here.


