For marketers and business tycoons, Facebook isn’t just another social media platform, it’s a dynamic space where they monitor their audience behavior, algorithms, and make every move count. If you’re running campaigns, building brand visibility, or just trying to keep up with the current trends, you need more than surface-level knowledge.
This blog is built to do exactly that. It brings together everything you should know about Facebook’s current landscape. Let’s see how.
Facebook Usage Statistics
Let’s not beat around the bush and understand how people use Facebook today. Facebook usage lenses into the platform’s real-time relevance—who’s logging in, how often, and what they’re doing.
Whether you’re targeting new audiences or optimizing content delivery, the numbers below reveal how engaged the world still is with Facebook in 2025.
- Facebook currently has 3.065 billion monthly active users (MAUs).
- Facebook has 2.11 billion daily active users (DAUs).
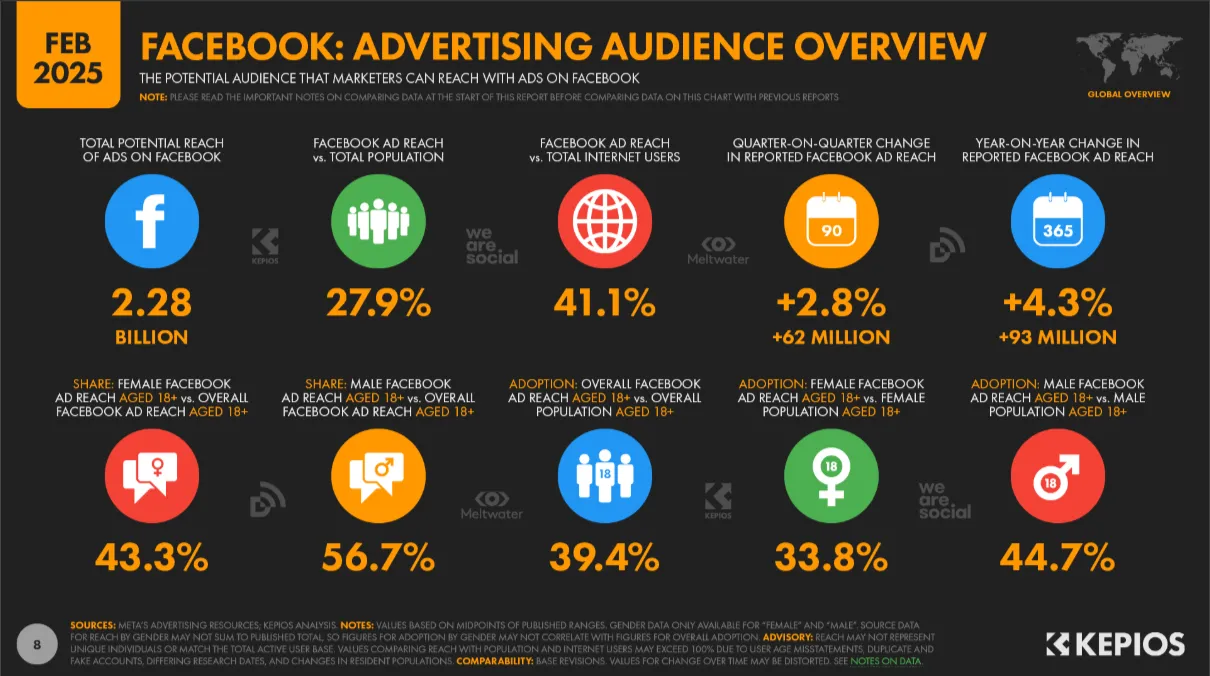
- Facebook’s global potential audience reach figure increased by 4.3% in the 12 months.
- Facebook ranks 1st as the most used social media platform.
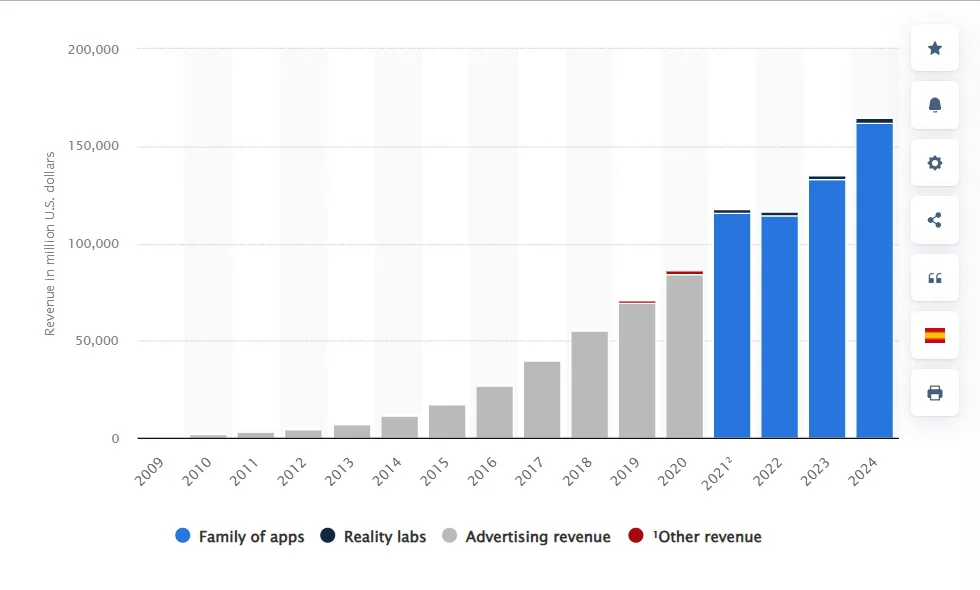
- Meta generated an annual revenue of $164.5 billion in 2024.
- There are more than 250.2 million Facebook users in the US alone.
- US adults spend an average of 20 minutes per day on Facebook. This refers to users aged 18 and older and accounts for access across all types of devices.
- 98.5% of Facebook users access the app on mobile-only devices, with only 1.3% still using the desktop-only website.
- Among Facebook users, 43% say they regularly get news from the site.
- 33% of U.S. teens aged 13 to 17 reported using Facebook.
Sources: Backlinko, Data Portal, Social Media Users, Meta Statista, Oberlo, Emarketer, Business of Apps, Pewresearch, Pewresearch centre, Ranking Statista, Meta Annual Revenue, FB User US
Facebook Demographics Statistics
Who’s still spending time on Facebook in 2025? Is it still a hub for Millennials or have Boomers taken over the feed? What about Gen Z – are they really tuning out?
These questions marketers can’t afford to ignore. Knowing who your audience truly is – by age, gender, and region – can reshape your efforts.
Let’s break down the real statistics.
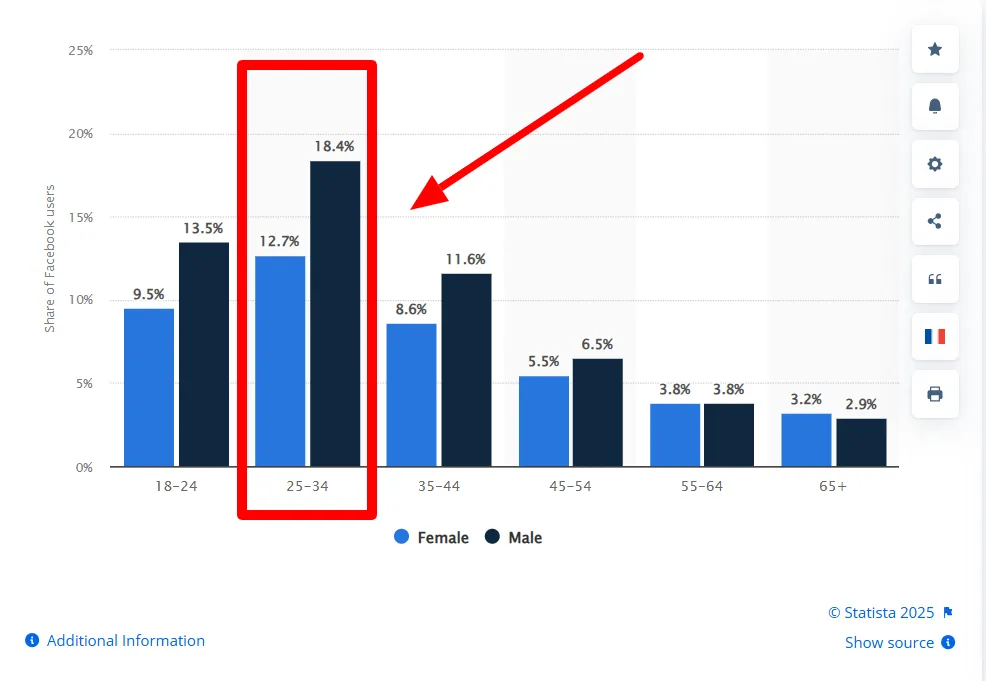
- As of 2025, 43.3% of Facebook’s global audience is Female, while 56.7% is Male.
- Audience between the ages of 25 and 34 years accounts for Facebook’s largest audience. 18-24 is the second largest age group.
- Facebook’s user base in the United States comprises approximately 53.8% females and 46.2% males.
- In 2025, 73.99% of the Internet users in the United States use Facebook regularly and is projected to rise to 75.79% by 2027.
- 18% of Social Media users in the United States believed that Facebook protected their privacy and data, with trust levels varying across generations: 28% of Millennials, 19% of Gen X, 18% of Gen Z, and 10% of Baby Boomers.
- As of 2025, India is dominating Facebook’s user base with 378.5 million active users, USA has 193.8 million active users, Indonesia with 119.5 million active users, Brazil with 112.55 million active users and many more in the list.
- Facebook would lose approximately 1.5 million teen users (age 12 to 17) this year.
- Only 3% of US Teens say that they use Facebook “almost constantly”.
Sources: Data Portal, Global Facebook User Age, US Facebook Statistics, Share of Social Media Users, Business Insider, Pew Research, FB Users Country Statistics
Facebook Engagement Statistics
Engagement is the heartbeat of any social media platform. Facebook is no exception. In 2025, understanding how users interact with content is more important than ever. Let’s see how brands can stay at the centre of the conversation.
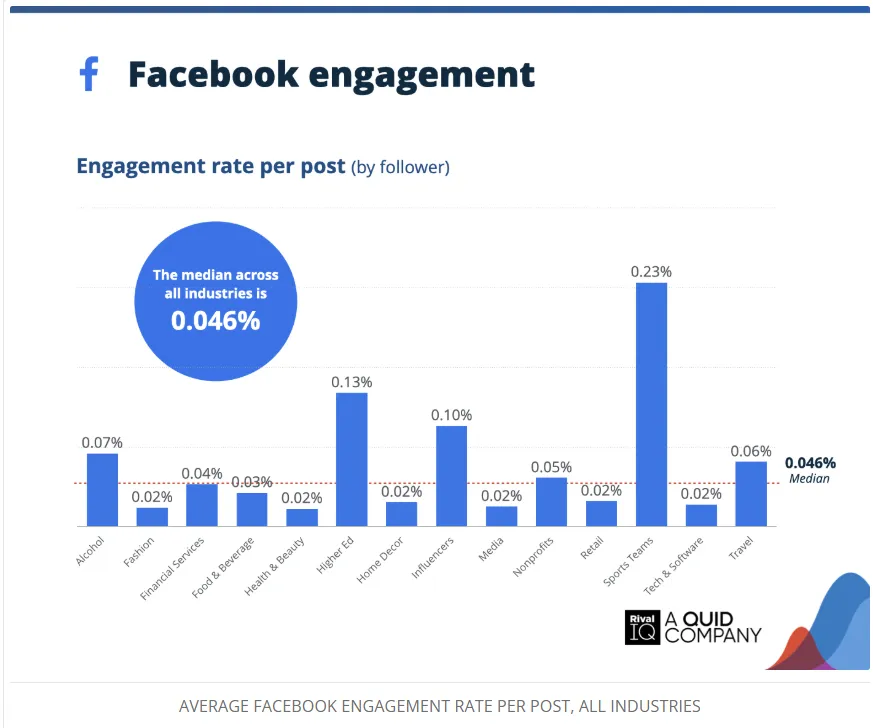
- As of 2025, the average Facebook engagement rate per cost across all industries is 0.046%, with Sports teams leading at 0.23%, while sectors like food and beverage and health and beauty trail at 0.03% and 0.02%, respectively.
- The average Facebook page fan engagement rate is 0.06%.
- Photo posts generate the highest engagement rate with 0.11% while being posted 2 times per week on average in the Influencers Industry.
- The average time spent on Facebook per day is 30.9 minutes.
- Adult Facebook users spend 8 days a year on Facebook.
- Facebook has 98.5% of its users using the platform with a mobile device.
- Facebook stories show 500 million active users.
- Facebook Live’s total average monthly watch hours is 32.6 million.
- Facebook Live had 66 million watch hours, which is 0.78% of the total.
- 68% of companies use Facebook Live for video Marketing.
- 57% of companies say Facebook Live is the most effective video marketing channel.
- Facebook users spend 3x longer watching Live Videos.
Sources: Rival IQ, Charle Agency, Backlinko, Social Shepherd, Adam Connell
Facebook Business Statistics
Today, Facebook stands as a vital business ecosystem where brands connect with audiences, foster communities, and drive real results. From local shops to global enterprises, businesses of all sizes continue to rely on Facebook to build visibility.
These statistics below provide a deeper look into the platform’s enduring role in modern marketing.
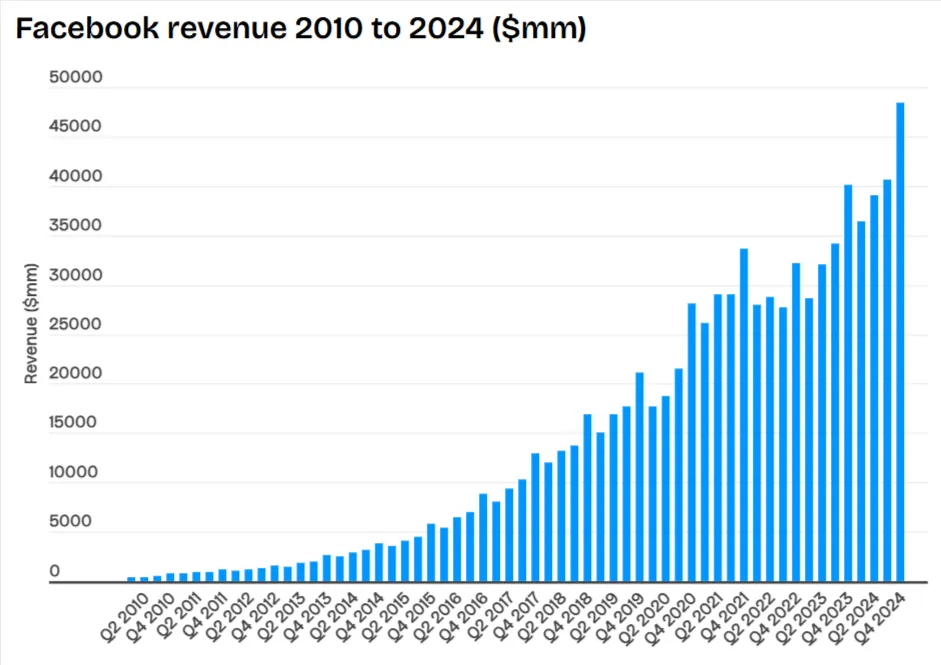
- Facebook’s annual revenue increased by 21.9% to $164.5 billion.
- About 43.7% of Facebook’s revenue comes from North America.
- Facebook reported $62.3 billion net profit.
- Roughly $94 million in social commerce is estimated to be generated in 2025 on Facebook.
- 250 million sellers worldwide use Facebook Marketplace.
- 22% of global B2B marketers say Facebook offers the highest ROI of all social platforms.
Sources: Business of Apps, Web FX
Facebook Advertising Statistics
Behind every scroll is a strategy—and behind every strategy is a budget that hopes to perform. With rising competition, evolving user behavior, and smarter algorithms, getting results now requires precision, timing, and insight.
These advertising statistics offer a behind-the-scenes look at what’s actually working on Facebook today.
- Facebook’s advertising reach has grown to 2.28 billion users, reflecting a 4.3% increase over the past 12 months.
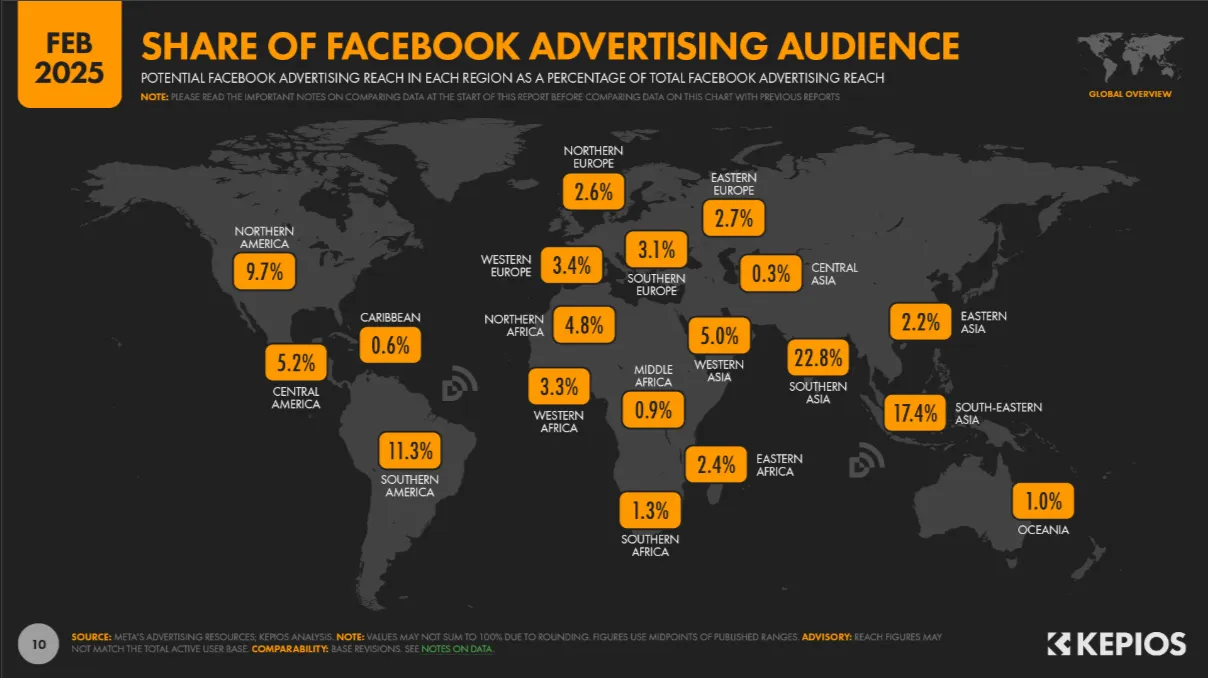
38. As of January 2025, Facebook’s advertising audience data shows 221 million active users in North America, 120 million in Central America, and 13.8 million in the Caribbean.
39. Ad impressions across Meta’s platforms grew by 7% over the year.
40. Facebook ads see an average CTR of 2.53%.
41. Advertising for traffic campaigns on Facebook costs $0.77 per click.
42. Meta platforms’ average revenue per user reached $49.63 USD in 2024.
Sources: Data Portal, Business Insider, Sprout Social, Meta ARPU Statista
Conclusion
Facebook continues to evolve, but one thing remains clear—it’s still a powerful space for marketers who know how to navigate it. Understanding the platform’s usage, audience, engagement, business activity, and ad dynamics is no longer optional—it’s essential for making smarter, faster, and more effective marketing decisions.
Whether you’re managing one brand or multiple clients, staying ahead means pairing these insights with tools that simplify execution. Platforms like SocialPilot help turn strategy into streamlined action—so you spend less time juggling and more time growing.
If the numbers tell the story, now’s the time to write your next chapter—better informed, better equipped, and ready to move.

