Instagram is not just evolving; it is continually reshaping how users engage, brand markets, and trends emerge. With each update, new behaviors, opportunities, and challenges arise, making it more critical than ever to stay ahead of the curve.
Over time, we’ve observed changes in audience preferences, content formats, and platform dynamics that directly influence how marketers operate on the platform.
The question isn’t just “What’s New” – it’s how users are responding and where Instagram is heading in 2025.
This blog dives into the latest Instagram statistics, offering insights to refine your strategies and maintain a competitive edge in this dynamic world.
Leverage trends and
trend on Instagram.
General Instagram Statistics
Instagram, with 2.4 billion monthly active users, has evolved far beyond a photo-sharing app. It is now a global powerhouse where brands, creators, and daily users shape our digital culture.
With billions of scrolling, swiping, and engaging content, the platform is a goldmine for marketers.
To truly harness the power of Instagram in 2025, let’s break down the numbers that define this digital giant.
- Instagram has over 2.4 billion monthly active users worldwide.
- Instagram has over 500 million daily active users (DAU).
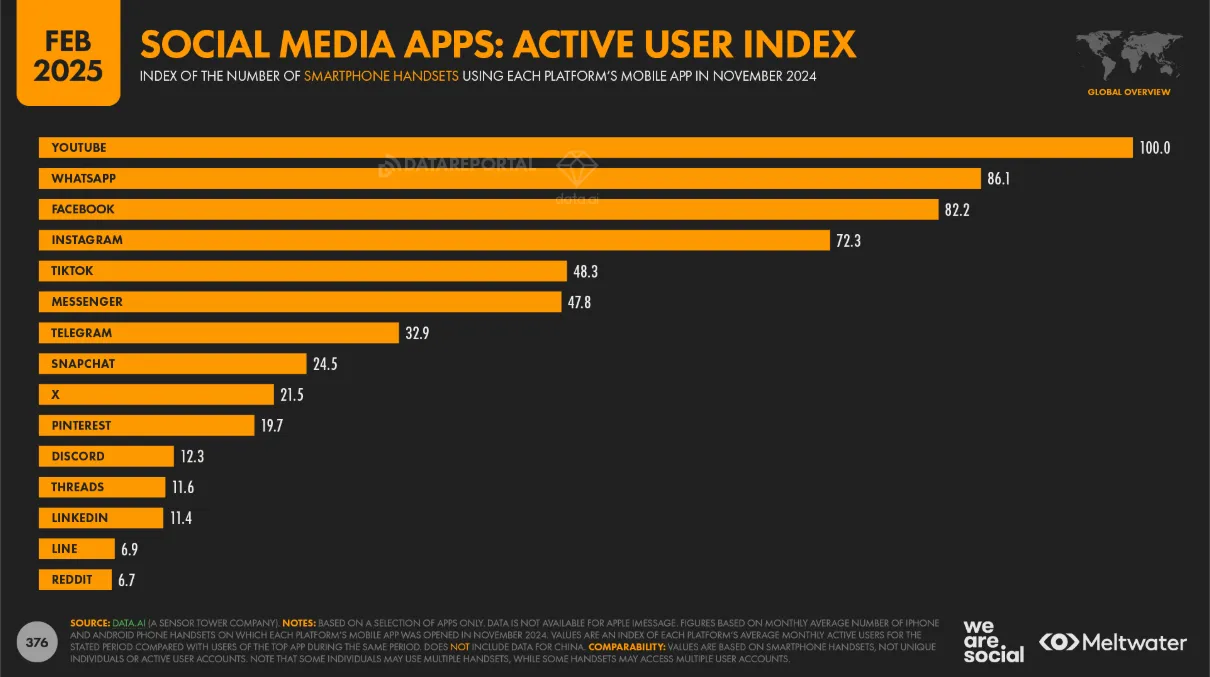
- Instagram has an active user index of 72.3, trailing behind YouTube, WhatsApp, and Facebook.
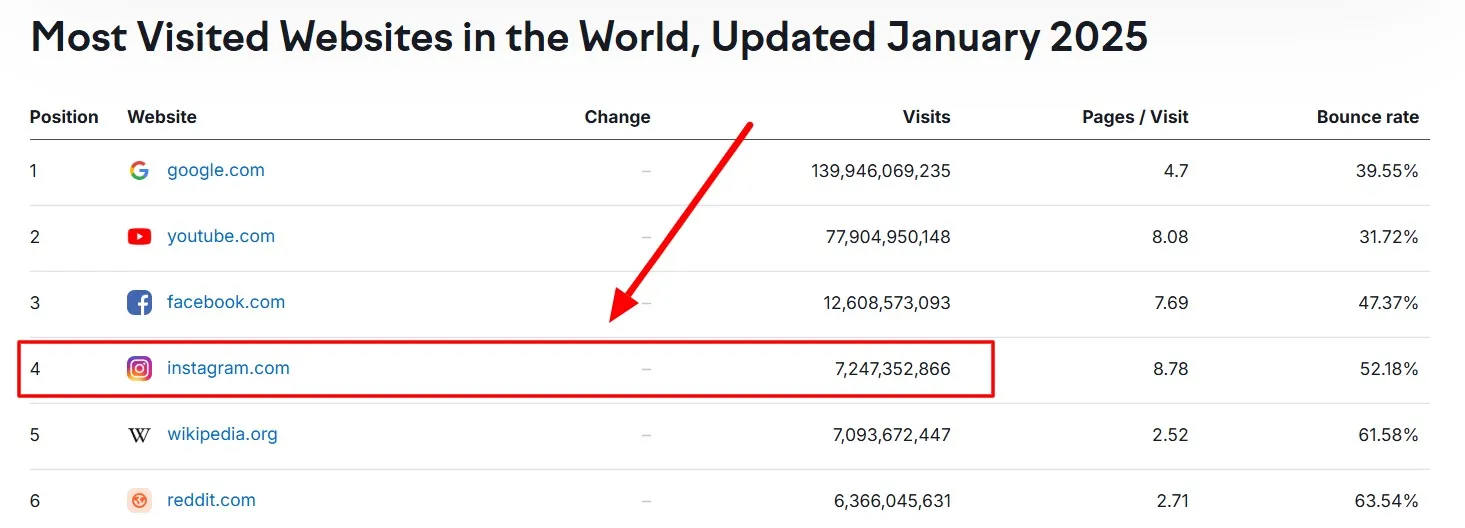
- As of 2025, Instagram ranks as the fourth most-visited website in the world, trailing only behind Google, YouTube, and Facebook.
- Instagram is the 4th most searched term on Google, with a massive search volume of 7,247,352,866+
- Approximately 20.3% of all active internet users use Instagram daily – for example, 16.6% of adult social media users globally cite Instagram as their favorite platform.
- Instagram has the third-largest ad audience, with a total users reaching 1.74 billion.
Source: Statista, Instagram Trends Report, Dataportal
Instagram Usage Statistics
Instagram’s usage pattern has evolved over time, reflecting its shift to how people interact with content, its brand, and within communities. The way users spend their time on the platform is constantly changing.
With a massive and highly active user base, Instagram remains one of the top platforms for engagement, offering opportunities for brands and marketers.
Here are the key insights that define how people are interacting with the platform in 2025.
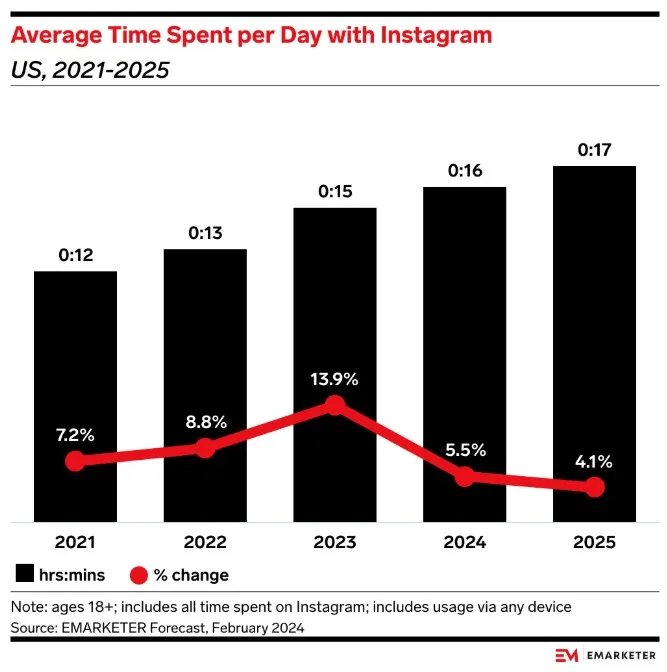
- Instagram users worldwide on Android devices spend an average of 30 minutes daily on the app, with U.S. users averaging 17 minutes per day.
- 90% of Instagram’s user base interacts with Reels content regularly.
- The most-liked picture on Instagram to date is of Lionel Messi and his teammates after winning the 2022 FIFA World Cup, with more than 75.4 million likes.
- 21% of Instagram users log in weekly, and 16% log in less often than that.
- 38% of users log on to the platform multiple times per day.
- 70% of users watch Instagram Stories daily.
- More than 100 million people watch Instagram Live every day.
- Video posts see 49% more engagement than photos.
- Average posting frequency: Users post 15 times per month.
- Average video watch time: 8 seconds per video.
- Content distribution: Videos account for 34% of published content.
- Reels reach: Videos (especially Reels) reach 49% more audience than carousels and photos.
- Post-collaboration usage: Only 1% of posts include collaborations.
- Posts including mentions: 84% of posts do not include mentions
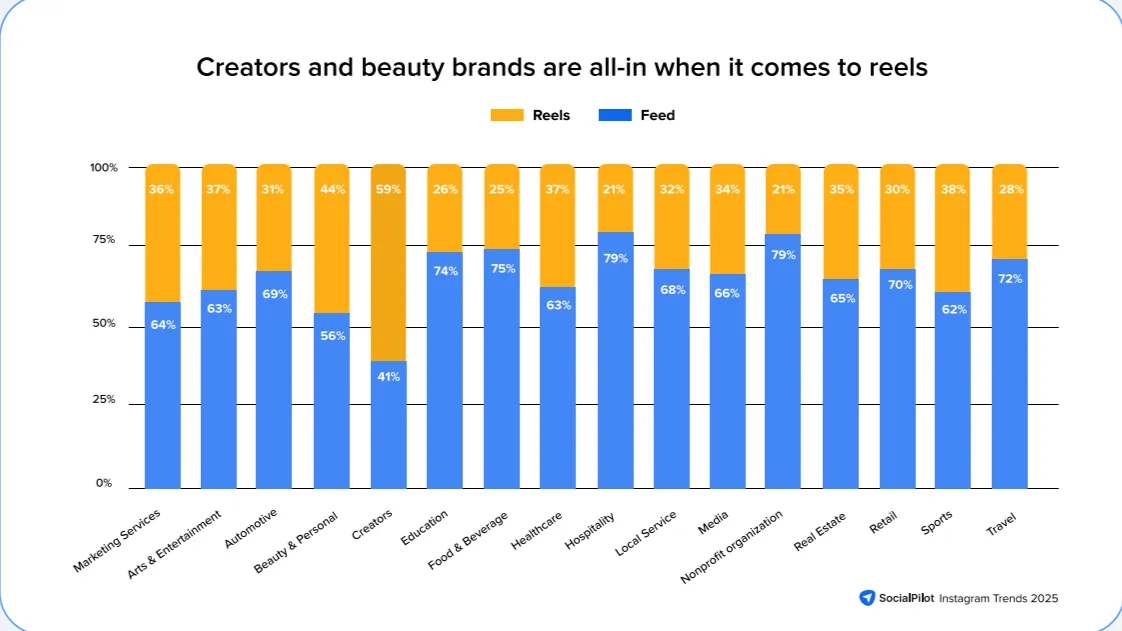
- 59% of creator content is Reels.
- Beauty brands use Reels for 44% of their content.
- Food & Beverage / Hospitality brands rely on images (60-66%).
Source: Measurestudio, Instagram Trends Report, Backlinko, emarketer
Instagram Demographics Statistics
Instagram is a mixed bag of trendsetters, shoppers, meme lovers, and business owners with all the double-tapping games throughout the day. From Gen Z fueling viral trends to millennials making purchasing decisions and boomers quietly keeping up, Instagram’s audience is diverse.
But who’s ruling the platform in 2025? Let’s find out.
- The highest number of Instagram users are from India (413-414 million), followed by the U.S. (~171-172 million) and Brazil (~140 million).
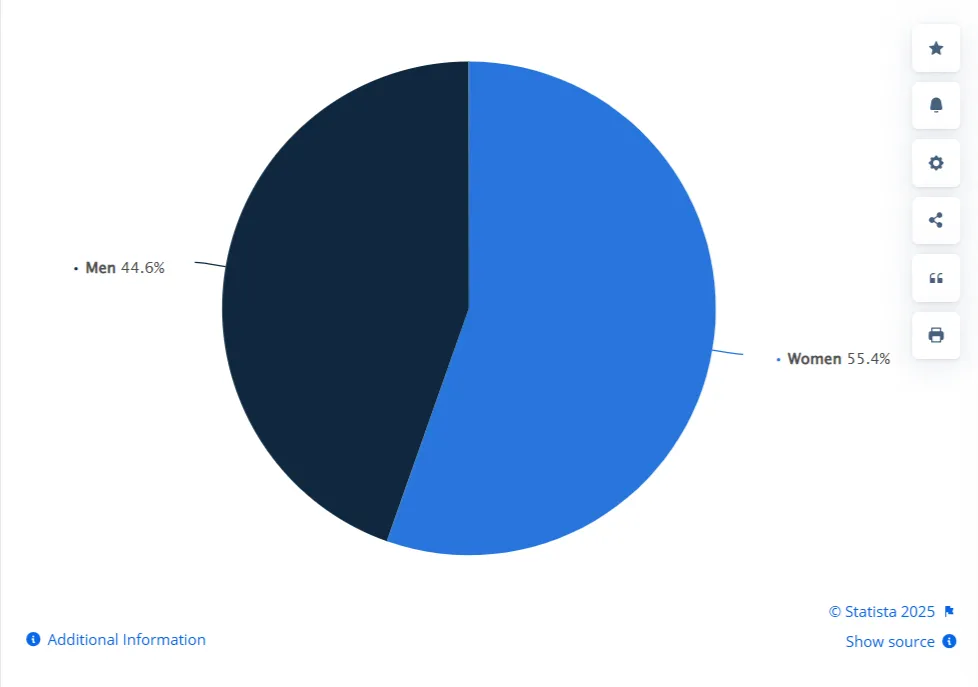
- Women make up 55.4% of Instagram’s user base, while men account for 44.6%, making it a female-dominated platform as of 2025.
- As of January 2025, 28.3% of Instagram users in the U.S. are aged 25-34, making up the largest audience in the country.
- The 18-24 age group follows closely, representing 26.5% of users, while 19.4% are aged 35-44.
- The least active group is users aged 65+, making up only 5.8% of Instagram’s audience.
- In 2025, 47% of U.S. teenagers use Instagram daily, with 8% checking almost constantly.
- 62.7% of Instagram users actively follow or research brands/products on the platform.
- Around 37% of Instagram users earn less than $30,000 annually, 46% earn $30k to $69.9K, 49% earn $70k to $99.9K, and 54% earn more than $100k annually.
- 85% of iOS Gen Z users aged 16-25 in the United States use Instagram.
Source: Statista, Distribution of Instagram User base
Instagram Engagement Statistics
Likes, shares, and comments are Instagram’s heartbeat. But in 2025, it’s not just about double-tapping on the content. It’s about conversations in DMs, interactions on reels, and the power of tags.
With audience behavior shifting faster than viral trends, what truly gets people talking, sharing, and engaging today? Let’s crack the code on what’s keeping Instagram buzzing.
Industry-Specific Reach Rates:
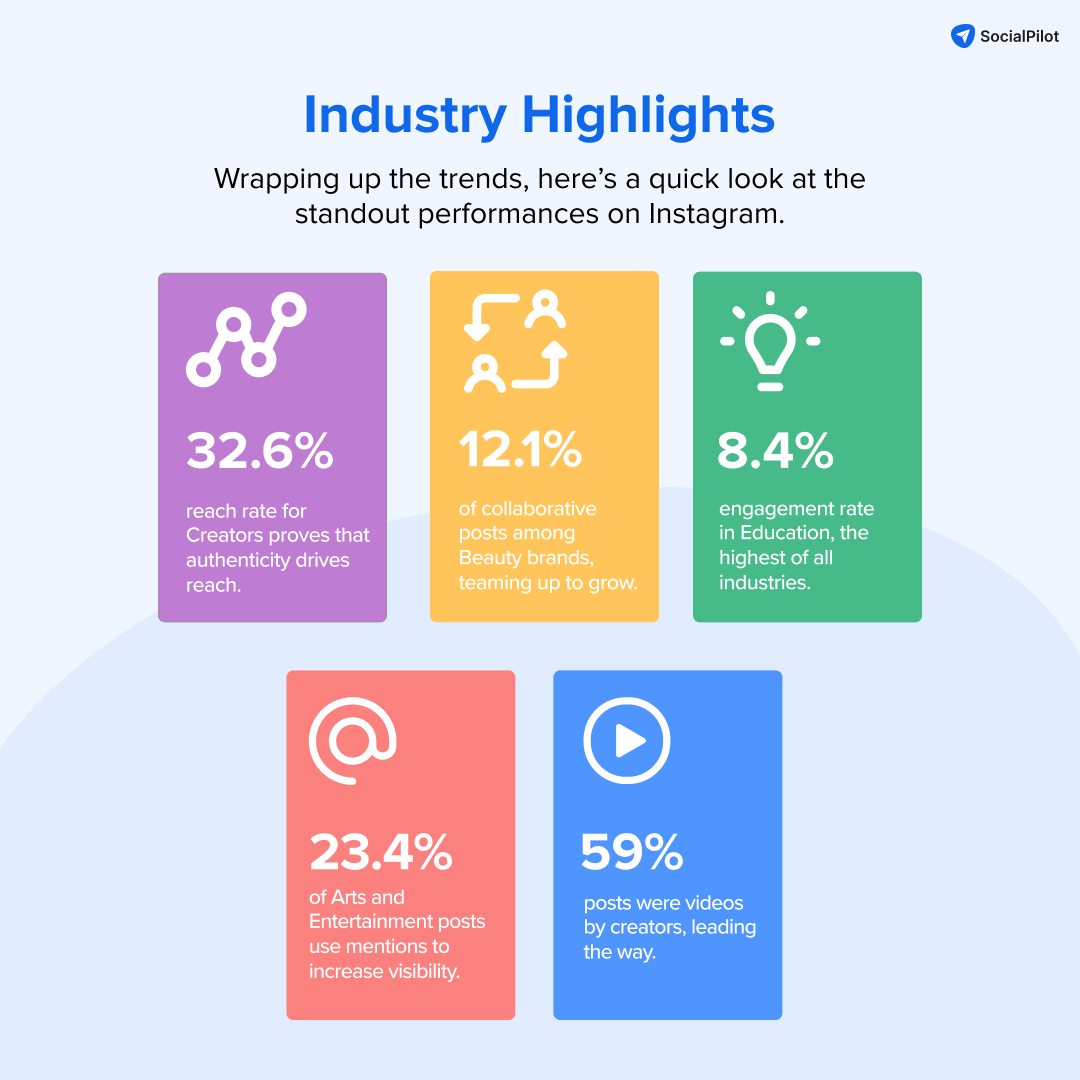
- Creators on Instagram lead with a 32.6% reach rate.
- The travel industry follows at a 21.4% reach rate.
- The sports industry has a 19.7% reach rate.
Engagement Rates by Industry:
- The education industry has the highest engagement at 8.4%.
- Travel & Healthcare brands rank next at 7.9%.
- Retail brands maintain 7.8% engagement.
Content Type Engagement:
- Carousels on Instagram have 22.73% higher engagement than videos and photos.
- Carousels make up only 17.27% of content but drive the most interactions.
- Videos generate 49% more reach than static images.
Hashtag Usage & Impact:
- Posts without hashtags reach 23% more audience.
- Using 2-3 specific hashtags is best for content discoverability.
Caption Length Impact:
- Captions over 300 characters drive 70% more comments.
- Long captions encourage meaningful discussions and interactions.
Collaborations & Mentions Impact:
- Posts with 4-5 collaborators reach 3.8x more audience.
- Arts & Entertainment brands lead in mentions (23.4%).
- Travel brands follow closely at 20.2%.
- Photos with faces perform almost 38% better than those without faces.
- Instagram Videos get 21.2% more engagement compared to images.
- Every month, 2.35 billion people interact with Instagram Reels.
Source: RivalIQ, Instagram Trends Report, Measurestudio
Instagram Business and Advertisement Statistics
In 2025, Instagram isn’t about aesthetic pleasing feeds, it’s a full-fledged business hub. From small businesses to global powerhouses, brands are finding new ways to attract, engage, and convert.
But what’s actually working right now? Are businesses getting ROI? Do stories still drive sales? Let’s break down the numbers and see what’s fueling Instagram.
- 90% of Instagram users follow at least one business account.
- 61% of users use Instagram to discover new products.
- 75% of companies (especially B2C brands) are on Instagram in 2025.
- 68% of marketers say Instagram provides positive ROI for campaigns.
- 79% of marketers say Instagram is essential for influencer campaigns.
- Over 53% of U.S. marketers leveraged Instagram Reels for influencer marketing.
- Instagram’s advertising revenue is forecast to reach $71 billion.
- Reels between 60-90 seconds generate 24% more shares.
- Short, engaging videos increase ad reach and impact.
- Posts with mentions increase reach by 2x and drive 30% more engagement.
- Mentions signal value to Instagram’s algorithm, leading to better visibility.
- An average sponsored post on Instagram costs $1,300.
Source: CapitalOne, Instagram Trends Report, Statista
Conclusion
Instagram isn’t just growing—it’s evolving. With new features, changing engagement trends, and shifting audience behaviors, marketers who stay ahead of these updates will win big in 2025.
But here’s the deal—knowing the stats is one thing; using them to fuel your strategy is another. That’s where SocialPilot comes in.
From scheduling your posts at peak engagement times to analyzing performance metrics and streamlining your content workflow, SocialPilot gives you everything you need to turn these insights into real results.
Try it today and take your Instagram game to the next level!

