In a digital globe where attention spans are shrinking and video consumption is soaring, YouTube continues to shape the way people discover, learn, shop, and connect with each other. What began as a simple video-sharing platform has evolved into a global ecosystem for many.
As we move deeper into 2025, YouTube’s influence spans far beyond entertainment. With features like Shorts, advanced ad targeting, and smart TV integration, the platform is rewriting the rules of engagement.
To help you stay ahead, we’ve compiled 30+ YouTube statistics that reveal how the platform is performing, who’s watching, what’s trending, and where the biggest opportunities lie. Whether you’re a business, creator, or strategist, these insights are your roadmap to navigating YouTube in 2025.
YouTube Demographics Statistics
Before crafting content or launching campaigns on YouTube, it’s essential to understand “who” exactly you’re trying to reach. From age and gender to geographic and behavioral trends, the platform’s audience is as diverse as its content library.
This year, YouTube continues to attract billions of users across generations and continents. Below demographic insights offer a clear snapshot of how YouTube’s global community is evolving and where the greatest audience opportunities exist.
- As of February 2025, YouTube’s monthly active user base has reached 2.74 billion.
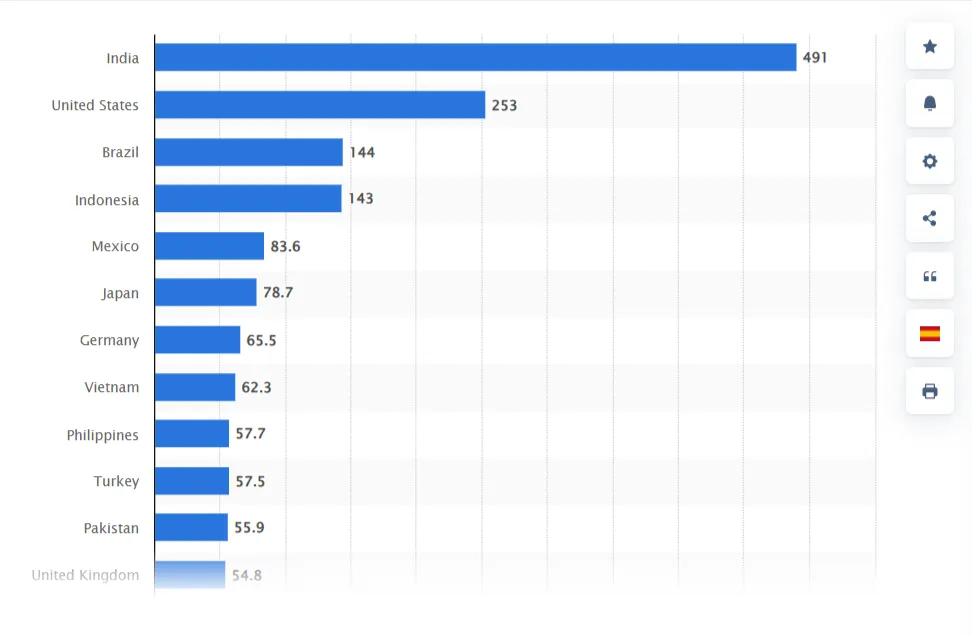
- India led YouTube’s global audience with 491 million users, followed by the United States with 253 million, Brazil with 144 million, and Indonesia with 143 million.
- Approximately 54% of YouTube users are male and 46% are female globally.
- 50.2% of US YouTube users are women, and 49.8% are men.
- Male users aged 25-34 made up 12% of YouTube’s global audience, while female users in the same age group accounted for 9.7%. In the 35-44 age bracket, men represented 10.1% and women 8.4% of the platform’s total user base.
- YouTube penetration rate has been recorded the highest in Saudi Arabia with 95.8%, Israel with 93.3%, and Singapore with 91.8%.
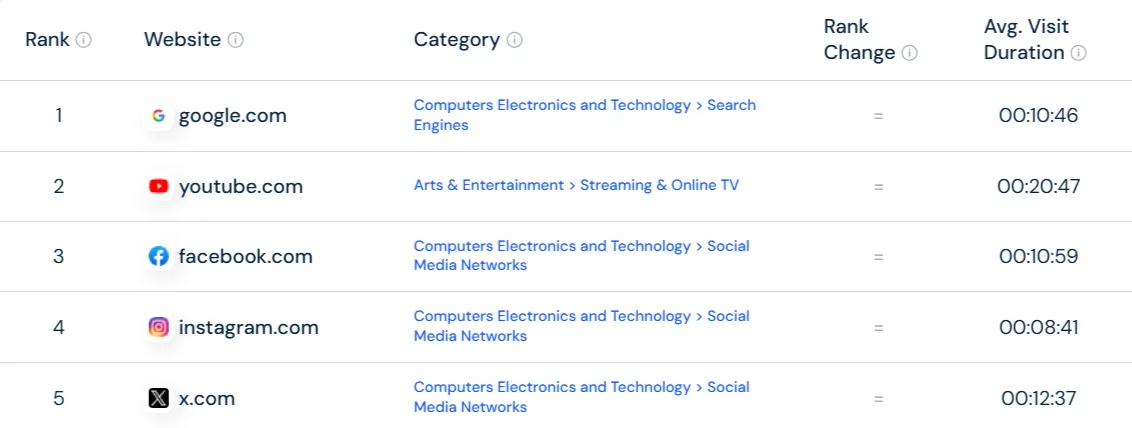
- YouTube is the 2nd most-visited website following Google with a record of 56 billion visits on mobile and over 23 billion visits on desktop devices.
- YouTube is available in over 100 countries with more than 80 Languages.
Sources: Business of Apps, YouTube Users Statista, Gender Distribution Statista, Global User Gender Distribution Statista, YouTube Penetration Statista, Monthly visit Statista, Similar Web, US Gender Reach Statista, Charle Agency
YouTube Usage Statistics
From daily watch time and device preferences to content consumption patterns, usage data paints a clear picture of how deeply integrated YouTube is in everyday life.
Whether it’s tuning in during lunch breaks, binge-watching on smart TVs, or scrolling through Shorts on the go, users are engaging with content more frequently, across more formats and touchpoints than ever before.
Let’s find out how the following statistics offer valuable insights.
- Users worldwide spent more than 27 hours using the YouTube mobile app per month. In the United States, each user spent approximately 24.43 hours on the mobile app.
- YouTube Premium and Music together have more than 100 million subscribers worldwide.
- YouTube users consume over 1 billion hours of video daily.
- In 2025, YouTube will have over 5.1 billion videos, and uploads will increase by over 360 hours every minute.
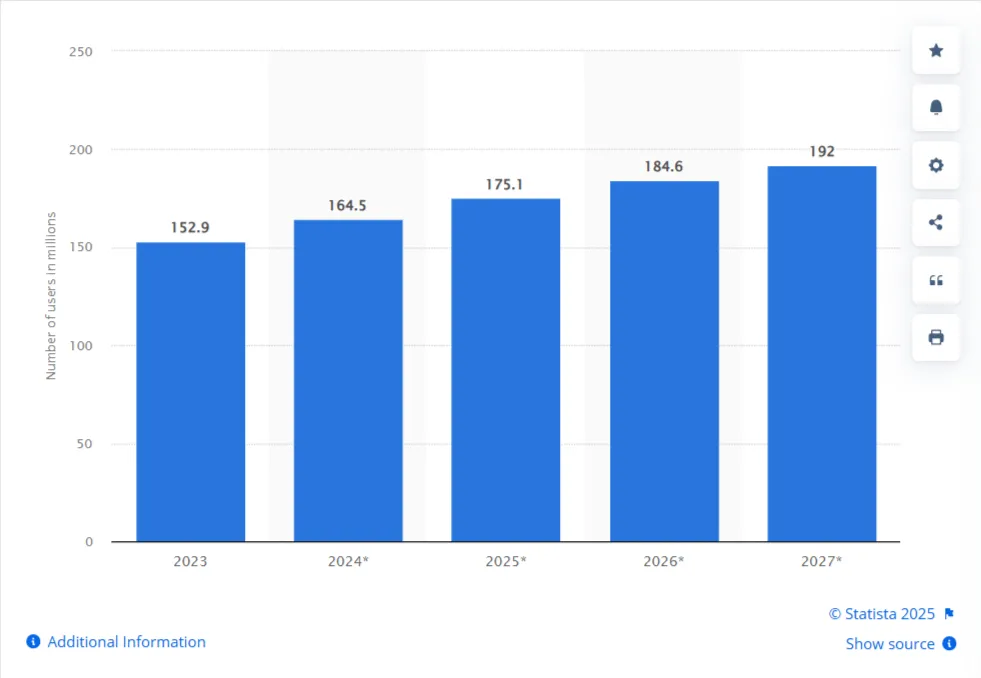
- This year YouTube Shorts is projected to reach 175.1 million users in the US.
- YouTube CEO Neal Mohan revealed that viewers watch more than 1 billion hours of YouTube content on their TVs daily.
Sources: Time Spent Statista, Global Media Insight, Seo AI, YouTube Shorts Consumption Statista, The Verge
YouTube Engagement Statistics
It’s one thing to have views—it’s another to hold attention, spark interaction, and drive action. That’s where engagement comes in.
You might ask: What kind of content keeps viewers coming back? Which formats drive the most interaction? And how are creators and brands converting passive viewers into active communities?
The following stats unpack how deeply audiences are connecting with content.
- A significant 74% of Gen Z identify as video content creators on YouTube.
- 92% of fans use YouTube to consume content about the person or thing they’re a fan of at least weekly.
- The average engagement rate on YouTube was 3.87%.
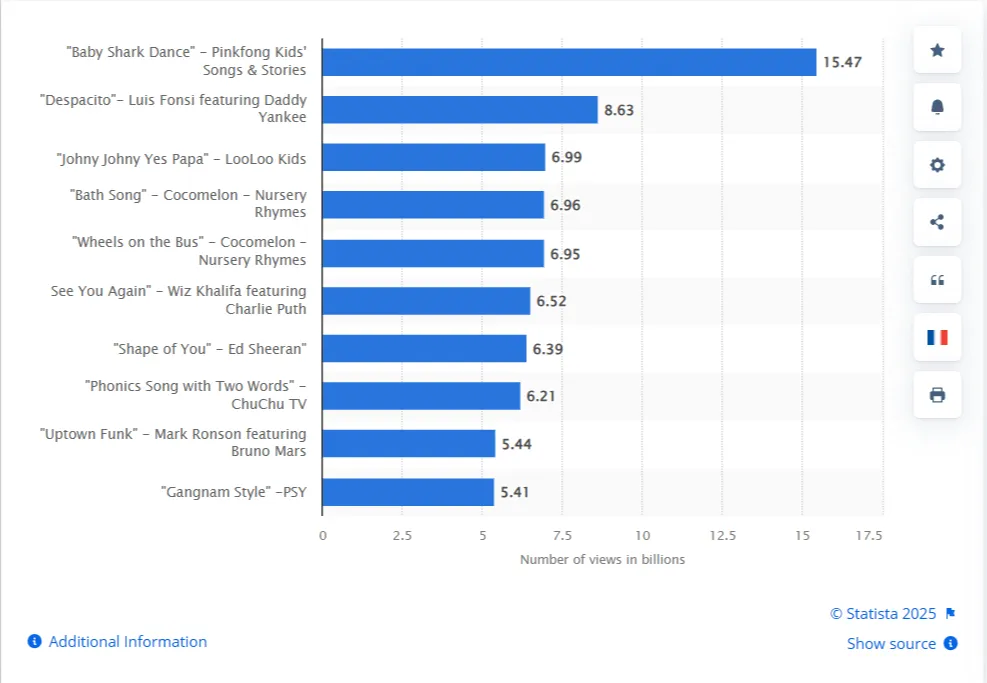
- As of 2025, “Baby Shark Dance” leads as the most-viewed YouTube video globally with 15.47 billion views, followed by “Despacito” at 8.63 billion views.
- The average YouTube Short duration is 33 seconds.
- People and Blogs were the most popular category for YouTube Influencers with 28.5% posting videos, followed by Entertainment and Games with 14.54% and 12.95%.
- YouTube is used by 89% of adults in the United States, making it the most widely used platform among American Adults.
- YouTube channels with 100,000 and 1 million followers have the highest engagement rate at 3.47%.
- 70% of YouTube users consider it as a trustworthy platform.
Sources: Google Business, Engagement Rate Statista, YouTube Video Statista, Hootsuite, Influencer Category Statista, Analyzify
YouTube Business Statistics
In 2025, YouTube supports a wide spectrum of business activity: from creator monetization and brand partnerships to ad-driven growth and direct-to-consumer commerce. But how significant is YouTube’s role in the modern business landscape? What does its economic footprint look like? And how are businesses—both global and local—leveraging the platform for tangible ROI?
The following statistics provide a closer look at YouTube’s business impact, offering key insights for marketers, advertisers, and decision-makers seeking to align their strategy with one of the world’s most influential platforms.
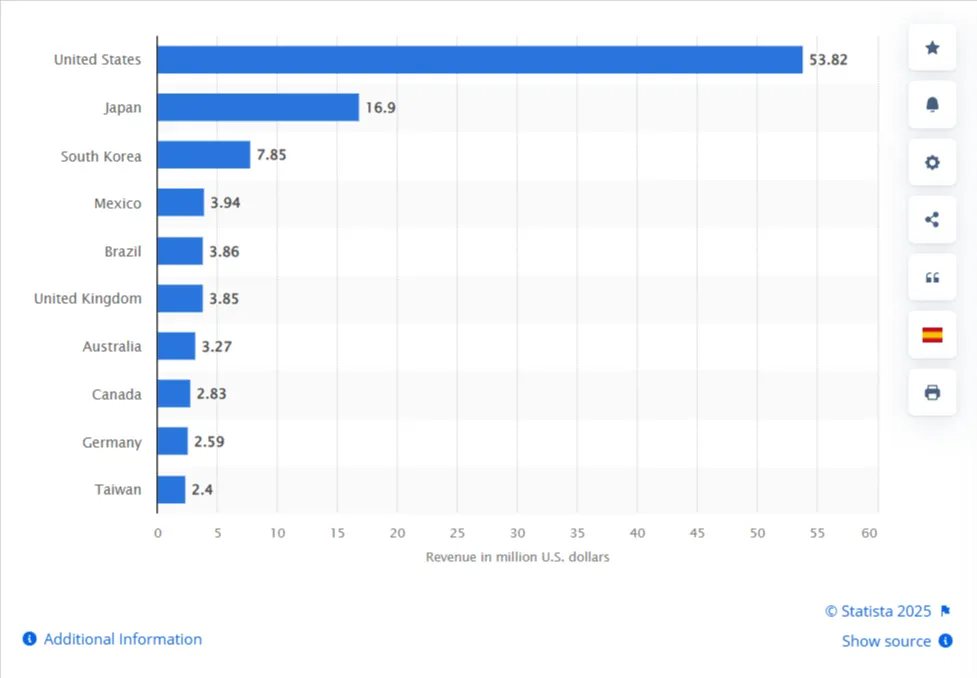
- The United States ranked first in YouTube’s in-app purchase revenues with $53.82 million. Japan came next with $16.9 million and South Korea with $7.85 million.
- 43.3% of marketers report enhanced product visibility using YouTube’s shopping collection.
- 51.6% of marketers use YouTube primarily for brand awareness.
- 37.7% of marketers find YouTube Marketing to be very effective in achieving their brand’s goals.
- Viral YouTube content can reach 100 million views in less than a day.
- Brands can drive 3x greater impact on purchase intent by using YouTube.
- 61% users say they are more likely to use YouTube feeds to research on products or brands.
Sources: In-app Revenue Statista, Influencer Marketing Hub, Hootsuite, Business Google
YouTube Ads Statistics
Advertising on YouTube has come a long way from simple pre-rolls. In 2025, it’s a dynamic ecosystem—where bumper ads, in-stream placements, Shorts campaigns, and brand collaborations all compete for attention in a scroll-stopping world.
This section explores the latest numbers shaping YouTube’s ad economy—unpacking where the budgets are going, how formats are evolving, and why brands keep doubling down on the platform.
- As of February 2025, India leads YouTube’s ad reach globally with 491 million users.
- Total potential reach on ads on YouTube is 2.53 billion.
- Singapore has the highest potential reach rate of YouTube ads in the Asia-Pacific Region with 92% among the adult population.
- YouTube was projected to generate an estimated $15 billion in advertising revenue.
Sources: Data Portal, Ad Reach Statista, Annual Revenue Statista
Conclusion
YouTube’s numbers in 2025 speak volumes—rising engagement, massive reach, and endless business potential. But turning those insights into impact? That takes more than strategy—it takes the right platform.
SocialPilot empowers you to manage, schedule, and analyze your YouTube content effortlessly—alongside all your other social channels. From collaboration and approvals to advanced analytics and client-ready reports, it’s built for brands, agencies, and creators who want results without the chaos.
Ready to streamline your social strategy and scale smarter?
Make YouTube marketing easier, faster, and better.

